Sunday, November 30, 2014

G7: Trying to get the damn door open


Soon as we got past that first model I hit a brick wall. There are five models to consider in Part 2 of Chapter 1 of Part 1 of The Craft of Economic Modeling. But it's like they left something out.

The first model we did, that one's not even numbered I guess. In Part 2 of the chapter they talk about five models, starting with number one:

Model 1 just sets out the variables and identities that are central to the system of national accounts used in the United States. We may call it a pure-accounting model because it makes connections among variables based only on accounting definitions, not on economic behavior.

Okay.

On page 9 he gets into Model 1. There is a pretty interesting review of how the NIPA categories break down. Clopper Almon explains it well. For example:

Business current transfer payments (net) include legal settlements and theft losses. We first subtract the entire amount and then add back in the portion which went to persons. The stolen case of Bourbon is counted as income to the thief and, by the way, appears in Personal consumption expenditure and thus in GDP.

And I really like how he every once in a while tells you what he thinks:

If we may, for the moment, skip the Statistical discrepancy, which should be zero conceptually, we have reached Personal income before government action. This item is not in the official accounts, but I find it a convenient point of reference.

But things are missing. He writes
We can now summarize this first model in the following master file which shows the actual commands to the software we use to compute this model.

And he provides the text for that "master" file. But... is "master" the name of the file or just a generic term? And if it is the name, then what is the file extension?

I think maybe the file is called master.add and I'm going with that for now. But I'm not sure. And where is the data? He did say in passing that

The variable names shown in the code column are the ones used in the Quarterly Income and Product (Quip) data bank...

But I had to dig to find that quote, and now I have to dig to find a "Quip" file, and then I have to hope I've been making good guesses.

Things are missing. Yeah, yeah, I remember: In the intro Almon wrote, "Of course, as in any craft, a book can only help, not replace, a living teacher."

Yeah, yeah.

// UPDATE 4:45 pm

The Master file doesn't have an extension. And the first QUIP.ZIP file I found was an old one, from 2002, from the Inforum EconData Archives. You don't want to use that one. Too many variable names have changed. I started fixing errors, with some success, but it just got to be too much.

I found a better QUIP file. I hope, better. I didn't even test it out yet. Between fixing errors in the first QUIP and looking for a newer one, I didn't have any energy left to look at it once I found it.

Actually, what did I find? It was the AMI file, the "Accelerator-Multiplier Interaction" model, a ZIP file with a few versions of the MASTER file (no extension) and a G.CFG and the QUIP bank files and some other stuff.

This is starting to come together. A lot of work, but I'm making progress. Pretty soon I'll be able to get thru that first chapter. I'm itching to do more.

Saturday, November 29, 2014

Some little things I've learned about G7


When I first double-clicked the icon on my desktop to start G7, it opened a configuration utility that said my "Present Working Directory" was C:\G7\Demo\Basic_G.

(Actually, at the time it said C:\PDG\Demo\Basic_G but I have since changed the name of the installation folder to G7 because "PDG" doesn't mean anything to me. I will just refer to it as the G7 folder, and pretend it was always thus.)

The configuration utility identified my Present Working Directory, my Workspace Bank (ws.bnk) and my Default Bank (mrts.bnk).

When I clicked OK, the Configuration Utility closed and two other windows opened -- the G7 program, and an editor containing the basicg.add script.

When I closed the program and came back to it later, it identified the same working directory and the same banks. And it opened showing the same text it showed the first time.

I went around that circle a few times. But then I renamed my G7 installation folder from C:\PDG to C:\G7. And after that, the original demo wouldn't work. I finally solved that problem by using the BROWSE button in the Configuration Utility. The button opens a regular, Windows-looking FILE OPEN window and lets you change the working directory and select a configuration file.

In the Demo folder, for example, is a Graph folder and in the Graph folder is a G.CFG file. When I opened that config file the Present Working Directory and the Default Bank changed in the Configuration Utility. When I clicked OK to close the utility, G7 opened in the Graph folder, with a graph.add file open in the editor.

If I then close G7 and open it up again, it comes back with the Graph folder as the working directory and graph.add in the editor, just as it was when I closed G7.

So this tells me how to get the original demo back: Start the Configuration Utility, click BROWSE, move from the Demo\Graph folder, to the Demo folder, to the Demo\Basic_G folder, and open the G.CFG file I find there.

Click OK to close the Configuration Utility, and you are back to the original demo that came up the first time you started G7. Almost. The text field at the right end of the G7 toolbar says the graph.add file is still loaded and ready to run -- even though you can see the basicg.add file in the editor, plain as day.

So I clicked the LOAD button on the G7 toolbar, and double-clicked the basicg.add file to make it replace the graph.add file. After that, the original demo worked just like it did at the start.

So what did I learn?
  •   G7 wants to start up where it left off.
  •   That makes the BROWSE button a very useful tool, and
  •   it makes the LOAD button a very useful tool.

It seems a little odd maybe that one script file is loaded in the editor, and a different script file is loaded in G7. But I've seen that before, with Lisp files and AutoCAD. You have the Lisp file open in the editor, and you add some code to it, and you run the thing and it doesn't work. No, because the changes you made are only in the file you are editing, not in the file that is loaded into AutoCAD.

The Lisp editor solves the problem by giving you a way to "load" the file into AutoCAD. They don't say that you're loading it into AutoCAD. They just say that you're loading it. But after you do it, AutoCAD knows about the changes you made. And now you can test them out.

With G7, after you use the BROWSE button and change things in the Configuration Utility, when you get to G7 you have to click the LOAD button to load the script into G7, even though it is already loaded into the editor.

It's strange how similar this is, what happens in AutoCAD and what happens in G7.

Thursday, November 27, 2014

Thankful for "G7"

This series of posts began on 18 November

Happy Thanksgiving.

First chance I've had to take a look at G7 since installing it.

When you first run G7 a configuration window opens. I don't understand the settings, so I just click OK. The configuration window closes and two new windows open. The bigger window is the G7 program. The smaller one is a demo file. There is no activity.

The G7 window tells my "present working directory" and provides the title of the data that's been loaded in. Looks like a setting in the configuration window determines which data gets loaded in.

The smaller window is more interesting. You can read it:

# This demo script provides the user with a solid foundation...

Several lines of text there, with a crosshatch before each line. I guess we should call it a "hash symbol" now. Several lines a "hash" prefix. Then

cls
addp n

CLS means CLear the Screen. I know that one. That's from BASIC. GW-BASIC had the CLS command, back in the days of DOS.

I don't know what the ADDP N is. Next there are several more lines of text

ic If you have any trouble with this demo script...

but this time the lines all start with the letters IC instead of a hash symbol. That tells me these lines are for a different purpose than those other lines of text. (When you run the script, the lines with the IC prefix are displayed as text. The lines with the hash symbol prefix are not displayed. I conclude that the hash symbol means the line is a comment, in the G7 language.)

Then there is the line

pause "When you are done reading, click OK."

followed by another CLS command.


Back in the bigger window, G7, I can type and see what I'm typing, but nothing happens when I press ENTER. I played with this a bit and had a thought. The smaller window is an editor... The smaller window is for user input. The bigger window is for G7's output. So then, if ENTER doesn't work in the big window it's not a problem. That window isn't for my input.

In G7 (the bigger window) across the top there is a toolbar with a few buttons: "G Editor", "Change Directory", "Change Font" ... I clicked on "G Reference". A Windows window popped up instead of the G Reference. The window said Windows Vista can't read older-style Windows Help files. There was a link to a download, an enhancement to Vista that lets me read the older Help files. It was easy to resolve this problem. But file it under Stupid Problems.

Windows can't read Windows Help files????? Give me a break!

So now the "G Reference" button opens the G Reference, and that'll be a handy thing. I went there, and went to "The Basic 11 G7 Commands" first, as they suggest.

This is amazing. Look what they have for the f command:

f <variable> = <expression>
f <variable>{<date1> [- <date2>]} = <expression>
    Defines variable on left in terms of variables in expression on right.

f x = gnp/(1. + unemp[1]*@exp(.25*time))
f index = x/x{85.1}

Note:  []  denotes lags  (t-1) is denoted [1]
        @  introduces a function (see list of functions)
        {date} on the right-hand side denotes a specific observation. 
        {date} on the left-hand side assigns values over the given range of periods.


First impression: Wow!

They give two forms for the "f" command (shown in green). The first one looks like a pretty simple assignment of value:

<variable> = <expression>

Create a variable and assign a value to it. Simple, everyday stuff you could find in any computer language, right? Yeah but hold on a minute. I read about the "f" command in the demo. Here's the relevant part of the demo script file:

ic =====================
ic HOW TO FORM VARIABLES
ic =====================
ic
ic f <variable> = <expression>
ic
ic A variable on the left-hand side is defined [as] the expression on right-hand
ic side. The new variable is stored in the workspace bank and can have
ic any name. For example, if you wanted to create an index of rtlsales44111
ic using June of 2000 as its base, type
ic "f index44111 = a.rtlsales44111/a.rtlsales{2000.006}" into the
ic command line. This new variable can be printed or graphed.

addp y
#
f index44111 = a.rtlsales44111/a.rtlsales44111{2000.006}
ty index44111
gr index44111
#
addp n

pause "When you are done reading, click OK."
cls


The number 44111 identifies some particular data series (sort of like TCMDO identifies a particular data series at FRED). You can make a variable that is an "index" of that series. The line

f index44111 = a.rtlsales44111/a.rtlsales44111{2000.006}

divides each value of the source data series by the June 2000 -- 2000.006 means the sixth month of year 2000 -- divides each value by the June 2000 value of that series. This creates a whole new data series that looks like the source series, but with the June 2000 value shrunk down to 1.0 and all the other values shrunk down in proportion. So the "variable" we create can be a whole new data series.

This is a big deal.

You'll often see me talk in those terms. I might show you a graph of TCMDO divided by GDP that displays 50 years of quarterly data. Four values for each year, so 200 values were used to make the graph. But when I talk about how these values change over the years, I say "the number changed" over the years, as if it was just one number rather than 200 separate numbers. Just one number (for a period of time).

Just one variable in G7, but the variable holds a whole data series. This is good stuff.

Tuesday, November 25, 2014

Installation: "I should have left the default"

This series of posts began on 18 November

EDIT, 3 DECEMBER 2014

Normally, I don't change my posts. This one has been undergoing major revision, because I don't want to steer anyone wrong who might use it as an instllation guide. So, this isn't the same post it was at the start.

IF YOU DON'T INSTALL G7 CORRECTLY, IT WILL GIVE YOU PROBLEMS. I HAVE TO KEEP EDITING THIS POST UNTIL I GET THE INSTALLATION RIGHT. I THINK WE'RE THERE NOW.

BUT, YEAH, I DID THINK WE WERE THERE BEFORE, TOO.

Inforum's The G7 Regression Program page is pretty friendly. And you can download the G7 from there.

So that's where I went, and clicked the shiny button to "Get G7 Here"
That took me to the Software Downloads page
Then I clicked the blue PDG link for the "Stable" version

PDG.exe, 26.3 meg
It's taking a few minutes...

The Software Downloads page says you have to "unblock" the file after the download. While waiting, I looked that up.

Delay's Blog says "ZIP files should be "unblocked" before their contents are extracted."
http://blogs.msdn.com/b/delay/p/unblockingdownloadedfile.aspx

TechNet says "By default, these files are blocked to protect the computer from untrusted files" and wants you to "review the file and its source and verify that it is safe to open."
(I forgot to grab the TechNet link.)

Nobody says how you're supposed to know if something is "safe".

The download took five minutes. I moved the file to a "temp" folder, unblocked it, and ran it.

WHEREVER YOU RUN THE DOWNLOAD FILE, IT CREATES A PDG FOLDER AND PUTS ITS FILES IN THAT FOLDER. SO MY CONCERN ABOUT LITTERING C:\ WITH FILES WAS UNFOUNDED. IT'S A SMART CONCERN, BUT IT WAS UNFOUNDED.

WHEN YOU RUN THE PDG.EXE DOWNLOAD FILE YOU GET SETUP.EXE AND A HANDFUL OF RELATED FILES. (I SHOW A SCREEN SNIP BELOW.)

I'm using Windows Vista, by the way, and hoping to upgrade at Christmas...

I didn't know what to do next. But the Software Downloads page starts by saying: "To install G7 on a machine for the first time, please follow the instructions on the G7 page." So I clicked that, and ended up back at the friendly page. It says:
PDG - This is a self-extracting ZIP file of the G7 program and other Inforum software. After downloading this file, run it by double-clicking on it, or by typing its name at a DOS prompt. Do this in a temporary directory. One of the files that will be extracted is SETUP.EXE. Next, run this setup program, and the InstallShield session will begin. This will load the software into the default location of C:\PDG. See the Readme files that are included in the installation for further instructions.

So far so good. Next, run setup.exe, the InstallShield Wizard.

A pretty picture of a house (or maybe, the building that houses Inforum) comes up in the InstallShield Wizard. After clicking "next" a couple times, a readme file comes up. This is not like something that I might throw together myself. It is all very professional. Trustworthy.

"307 file(s) unzipped successfully."

WHEN YOU RUN SETUP.EXE YOU GET THOSE 307 FILES.

OKAY.
FIRST YOU DOWNLOAD A FILE NAMED PDG.EXE AND UNBLOCK IT. THEN YOU RUN IT, AND WHEREVER YOU RUN IT, BY DEFAULT IT CREATES A FOLDER NAMED PDG AND IT PUTS A HANDFUL OF FILES IN THERE... INCLUDING SETUP.EXE.


It wanted to extract to c-root, C:\ and this time I let it. Here is the result:


A handful of files, including SETUP.EXE, in a PDG folder. Then I ran the SETUP.EXE:

THEN YOU RUN SETUP.EXE, AND BY DEFAULT IT CREATES A PDG FOLDER IN THE ROOT, AND PUTS 307 FILES THERE... INCLUDING G7.EXE, THE FILE YOU WANT.


I let it install in C:\ and here is the result of that:


The installed files are in a PDG folder which is in C:\. It works, if you let it.

Oh good, Windows Vista is given as an example of the environment you might be using for G7. The first stuff I read on this a few days back said Windows XP or 7 or 8 but didn't mention Vista. So far so good, then.

The readme says you have to add C:\PDG (the path to where G7 will be installed) to the Windows PATH variable. I did that right away because I wouldn't remember to do it after the installation is complete. The instructions are right there in the readme, and they are excellent. I didn't have any question in any step of the process. When they tell you to click OK, they also tell you which window you should be in at the moment, and I was in that window every time. I think that's the best computer instructions I ever saw.

THE INSTRUCTIONS ARE VERY GOOD. MY PROBLEMS AROSE BECAUSE I DIDN'T TRUST THEM, AND I TRIED TO DO THINGS TO PREVENT PROBLEMS. MY PROBLEMS AROSE FROM MY EFFORT TO PREVENT PROBLEMS. SAD BUT TRUE.

Oh, I'm gonna quote this bit for later:
To employ some of the newest features in G7, your system must have an installation of the Microsoft VC++ 2005 Redistributable package. You can find a copy of the VC++ installer under C:\PDG\VC++Installer. Run the installer before attempting to run G7.

Run the installer before attempting to run G7... but after I install G7. Which I didn't get to yet. I'm still reading the readme.


Okay, I'm done with the readme.

There are some questions related to installation. I just accept the defaults, unless I see something odd.

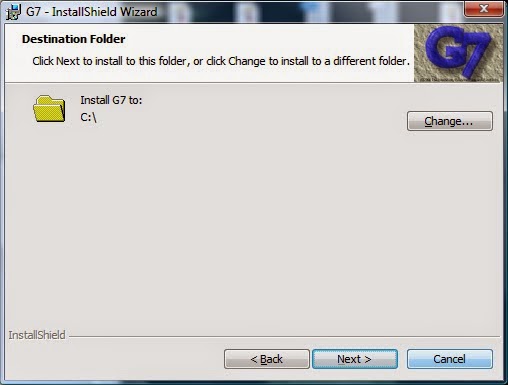
I see something odd. The InstallShield Wizard's Destination Folder window by default will install G7 to the root directory C:\ YEAH AND THAT IS OKAY!!! INSTALLSHIELD WILL CREATE THE PDG FOLDER IN THE ROOT DIRECTORY (AND THAT IS WHAT I WANT!) AND WILL PUT ALL THE INSTALLED FILES INTO THE NEW PDG FOLDER. IT WILL WORK FINE, IT YOU LET IT.

LEAVE INSTALLSHIELD THE DEFAULT PATH C:\ AND YOU'RE GOOD. I clicked next.

The "Typical" setup type installs everything. That's the default and that's what I want.

Now, click Install...
Start 5:12 AM...
After a moment the activity begins...
Oh, done! at 5:14.
Readme? Yes...
Yeah, this is the same readme file that I read before. I had to do something... Run the installer for VC++

Okay, now I can close the Temp folder and the Temp\PDG folder, and open C:\PDG.

VC++ Installer is there. It installs quickly but then there is a long delay while it says "time remaining 0 seconds"... but the window closed while I was typing this. Okay.

Close the VC++ Installer folder...
Close the Readme window...
Close the Control Panel window where I add PDG to the path...

Now I don't know what to do. Run the thing, I guess.

In the GDP folder I double clicked on G7.EXE and two windows opened. It's a demo. The one window is the demo and the other is the script for the demo, it looks like. But nothing is happening. In the script I see things like "When you are done reading, Click OK" but they don't show up in the demo.

Maybe I have to *run* it?

I click the triangle symbol in the demo window menu, the right-pointing triangle. The thing runs, I get a paragraph of text, and a "When you are done reading, Click OK" message.

Okay.

Monday, November 24, 2014

"The first section of chapter 1 does not require the use of computers"


Today's title is a quote from The Craft of Economic Modeling, Part 1 (PDF), by Clopper Almon. I take the quote to mean that I don't have to begin by getting into the modeling software they call G7. I take it to mean I can start with a spreadsheet. Not pencil and paper and slide rule.

Page six of The Craft presents Table 1.1, a table of data to use for the first simulation. For the first model, I mean. Ten columns of numbers. Most of them are incomplete. The first column (which is complete) contains the numbers 1 thru 24, in order. It is labeled "Line" (meaning 'row number') but I take it to represent years 1 thru 24 of the simulation I'm going to create.

Three other columns are also complete, each with 24 values. Here we have numbers that are predetermined and invariant, regardless of how the simulation works out. These complete columns hold "exogenous" values. Those values don't depend on the outcome of the simulation.

In each of the six remaining columns, only the first few numbers are filled in. These are starter values. A lot of them are used by the calculations of the model -- used by calculations to fill in the blanks where numbers are not given.

The calculations produce "endogenous" values. If things go a little differently in the simulation -- if you change an exogenous value or if you change a calculation, say -- the endogenous numbers will probably all change.

When I put the numbers into a spreadsheet, I switched over to calculations as soon as I could. That way I could compare my calculations to some of the givens, and check my work. In the Zoho spreadsheet, I show the numbers in blue if I used given values, and black if I used calculations. The table of numbers starts just below this graph:


Check my work. I was expecting my graph to come out like the one on page 5 --


But I only got two growth spurts. They got five. I checked my work and didn't see any mistakes. (Oh, there were mistakes. But you look at the graph and see the date when it seems to go crazy, and then you check your calculations on the rows around that date. And you fix 'em before you put it on your blog.) I think I got all the mistakes, but if you find anything fishy, let me know.

I'm assuming the page 5 graph was generated from different data, and that's why the graphs don't match.

If you create the model yourself, do let me know how it comes out.

Note: When you enter the equations it's easy to use the wrong column. It's easy to confuse spreadsheet columns with economic data category columns. For example, the last spreadsheet column used here is column J, which contains economic data column Y, Disposable Income. It's a little messy, keeping it straight. But if you don't do it right you'll know, because your graph won't look right.

// This series of posts began on 18 November 2014.

Sunday, November 23, 2014

Why


To speak of cause and effect in economics, one must have in mind some kind of model.  It may be an entirely subconscious model, or a model spelled out in theory but never quantified or tested, or an explicit, quantified model that has been subjected to careful testing and scrutiny. I need hardly add in which sort I have the greater confidence.

Friday, November 21, 2014

Columns in a spreadsheet go up-and-down, like columns in a building. Rows go across.


Following up on the post of 18 November...

When I picture an economic model, I picture doing it in a spreadsheet. I need a column for "Year", one for "GDP", one for "Debt", one for "Addition to Debt", and stuff like that -- whatever it turns out that the calculation seems to need. And then, make a row for each year of the model's life. I plug in a few numbers on the top row, then fill the rest of the first couple rows with calculations. And that's it.

I copy my last completed row down to the rows below, for each year of the model's life, 50 years maybe.

The trick is to plug in the right calculations. Those calcs want to mimic the actual relations between GDP and Debt and Additions to Debt and stuff, or what I imagine those relations to be. You know: If we spend a little less, we save a little more this year, but our reduced spending could affect GDP next year. Those kinds of relations.

When the bug bites I'll set up a spreadsheet like that and mess with it for a while, changing calculations, adding columns for new quantities, and looking at graphs of the resulting data.

I never manage to get graphs that mimic graphs of economic data. So I play with it for a while, then set it aside.


After I wrote the notes above, I went and read the first few pages of Clopper Almon's The Craft of Economic Modeling. Actually, Clopper says "The first section of chapter 1 does not require the use of computers." I printed out those six pages, so I could hold them in my hand.

Looking at the equations like

C = .6*Y[1] + .35*Y[2]

and

Q = C + I + G + X - M

where C is Consumption and Q is output, it occurred to me that each of the equations in the model could fit to a column of my spreadsheet. You copy the equation down the cells of the column to get each year's number. Oh -- you leave out the Q to the left of the equal sign, and you put the equation in the column that you have labeled Q!

Do you know how long it took me to figure that out???

So each of the equations in a model can be a column in a spreadsheet. Understanding this helps me understand economic models. What I've been doing for all these years is making a column for each variable I want to calculate, and then fudging the equations without ever really getting to look at the equations. I would start out with something that made sense to me, and keep filling in blanks until I had two or three rows worked out, then copy the last row down to represent 50 years or so, and then graph it.

Then I'd look at the graph, decide it didn't look right, and start tweaking my equations. First it would be adding columns to get more variables, and then working those variables into calculations and copying them to the rows below. Then it was things that made less sense, but might have some bearing. After a while it would be acts of desperation, just trying to come up with numbers that would produce a graph I could live with. And then I'd put the thing aside for a while.

I think it's probably better to pull out the equations so you can look at them like Clopper does, like I always see when somebody is describing a model.

But at least now I know: If there's two equations I need two columns in a spreadsheet for variables; if there's six, I need six.

No, no -- I'm not going to work only in spreadsheets. I want to download the free G7 software and learn how to use it. But I have to get there at my own pace. And I have to start with what I know.

Spreadsheets it is, then.

Tuesday, November 18, 2014

how to understand an economic model


So I finally Googled how to understand an economic model, something I really need to understand.

It was the article of the week at Reddit that drove me to it. I didn't read the linked article, just the comments on it at Reddit. Integralds lays out an overview of growth theory, of the development of growth theory, what standerby calls a "timeline of thought". It's easy reading, just a summary of developments. But it's impressive.

I didn't even click on any of the links. It wouldnt do me any good. Every time they start laying out a model my brain becomes impenetrable. Said to myself I need to know how to understand an economic model. Next thing I knew, it was Googled.

The fourth item in the Google results -- and the first one I hadn't been to before -- was The Craft of Economic Modeling, Part 1 (PDF, 149 pages) by Clopper Almon. Here's two bits of it, from the intro:
Simply put, an economic model is a set of equations which describe how the economy or some part of it functions. In my view, a model should incorporate and test our understanding of how the economy works. Its equations should make sense. And it should be possible to test how adequate our understanding is by running it over the past and seeing how well it can reproduce history. By changing some of its assumptions and rerunning history with the changed assumptions, it is possible to analyze the effects of policies. Finally, it should be useful not only for policy analysis but also for forecasting. By studying the errors of the forecast, the builder of the model may hope to improve his or her understanding of the economy.

Some of the equations in our models have constants which describe the behavior of firms, consumers, or other economic agents. These constants, often called "parameters", must somehow be estimated. The most frequently used way is by choosing them so that the equation describes accurately the behavior of those agents in the past. Thus, estimating the parameters is just a way to sum up the lessons of the past to forecast the future or examine how the past itself might have been different had different decisions been made. A large part of this book is about how to do that...

Yeah, I have to read this. I know, 149 pages. Usually if the page count is more than a single digit I start to worry. But I have to read this.

Oh yeah, one more thing:
The computer software, the G regression package, version 7.3, (referred to as G7) and the Build model builder, are comprehensive, easy-to-use programs that run under Windows XP and Windows 7 or 8. They are designed for work with time-series data. Public domain versions accompany the book or are available via Internet (www.inforum.umd.edu), where thousands of economic time series are also available as data banks for G7. Assembling equations into a model requires the use of the Borland C++ compiler, which is also available for free download...

Oh, my.

Monday, November 17, 2014

"An extremely persistent slowdown in long run growth rates since the 1970s"


Gavyn Davies, from his blog at FT:
NOTE: Davies' two "here" links didn't work for me, so I disabled them.
UPDATE 13 DECEMBER 2014: APPARENTLY DAVIES' LINKS DID WORK. I JUST NOW FOUND
SEVERAL COPIES OF TWO PDF FILES IN MY DOWNLOADS FOLDER. OH, WELL.
Three of my colleagues at Fulcrum have been examining the behaviour of long run GDP growth in the advanced economies, using developments of dynamic factor models to produce real time estimates of long run GDP growth rates. See the summary paper here by Juan Antolin-Diaz, Thomas Drechsel and Ivan Petrella, and the more academic version here.


The results (Graph 1) show an extremely persistent slowdown in long run growth rates since the 1970s, not a sudden decline after 2008. This looks more persistent for the G7 as a whole than it does for individual countries, where there is more variation in the pattern through time.

Averaged across the G7, the slowdown can be traced to trend declines in both population growth and (especially) labour productivity growth, which together have resulted in a halving in long run GDP growth from over 4 per cent in 1970 to 2 per cent now.

Impressive graph.

EDIT: Crossing things out:
I remember, probably 30 years ago, reading a review of a book by Glynn and Gavyn Davies. It was... At the time, the name of the book reminded me of Sidney Homer's A History of Interest Rates. I think the title was A History of Money. Glynn was Gavyn's father. This is all from memory; I could have it all wrong.

There ya go. The title: A History of Money: From Ancient Times to the Present Day. Author: Glyn Davies, only one "n". Maybe Gavyn wrote the review? I definitely remember both names. First published in 1994, according to Amazon; I was way off on the date. Price of the hardcover book, new, at Amazon? "From $2000". Oh, maybe that's why I didn't buy the book.

Anyway, that graph is huge.

Sunday, November 16, 2014

Rooting for inflation?


From VOX: The NAIRU, explained: why economists don't want unemployment to drop too low by Matthew Yglesias:
A middle ground would be to argue that perhaps the NAIRU did correctly characterize the economy of the 1970s. Back then, after all, a large share of the American workforce was represented by labor unions. Union contracts often included clauses that provided for automatic raises in the case of inflation. It's easy to see why any particular person would love to have such a clause in his contract. But it's also easy to see how widespread use of such clauses could inadvertently set off a spiral. Whether or not this was the case three or four decades ago, it's not a major issue in the American economy today, when many fewer workers have such contracts.

That's the whole paragraph. Here's the piece of it that's relevant for today's post:

It's not a major issue in the American economy today,
when many fewer workers have such contracts.

If you're thinking a little more inflation would help reduce our debt, you might want to think about whether your paycheck would be seeing that inflation. Debt doesn't inflate when wages inflate, so inflation can be helpful (though I do not favor that solution). But if prices inflate and wages do not, increasing inflation will leave us in worse shape than we're in now.

Saturday, November 15, 2014

"The role of the state in economic growth"


From the Abstract of The role of the state in economic growth (PDF, 59 pages) by Erik S. Reinert:

This paper attempts to trace and describe the role played by the government sector -- the state -- in promoting economic growth in Western societies since the Renaissance. One important conclusion is that the antagonism between state and market, which has characterised the twentieth century, is a relatively new phenomenon. Since the Renaissance one very important task of the state has been to create well-functioning markets by providing a legal framework, standards, credit, physical infrastructure and -- if necessary -- to function temporarily as an entrepreneur of last resort.

Friday, November 14, 2014

Real Adjusted Total Bullshit


Some time around 1994 apparently they changed the definition of M1 money. Before 1994 the definition of M1SL money included "sweeps". After 1994 it didn't.

So now, if you want to look at the same money measure before and after 1994, you have to look at what's called "M1 Adjusted for Retail Sweeps", or M1ADJ.

But this nomenclature is wrong. It's backwards. They changed the definition of M1 money, M1SL. That was the change. So when you look at M1SL, what you see after 1994 is not the same measure as before 1994. When they made the change, they should have made a new series to show the new numbers. This new series is the one that should have been called "adjusted for retail sweeps". I should be able to look at the old M1 money series M1SL and not see numbers that change suddenly and dramatically because of the adjustment.

Graph #1: M1SL (blue) and M1ADJ (red)
The data series title "M1 Adjusted for Retail Sweeps" implies that the change occurs in the M1ADJ data series, when really the change occurs in M1SL, the data series whose title makes no mention of the adjustment.

This is exactly the same kind of deceptive language you get when economists take GDP -- a measure of the stuff we actually bought, at prices we actually paid for it -- when they take GDP, and take the inflation out of it, and call the result "real" GDP.

Total bullshit.

Thursday, November 13, 2014

U.S. Public and Private Debt Relative to GDP, 1916-1970


Graph #1

... and the more recent picture:

Graph #2

Work with me here.

Graph #1 shows private debt (red) at a high level in the 1920s, and rising. Public debt was low by comparison, but drawn upward by troubles -- World War One, and the Great Depression, and World War Two. From around 1933 private debt started falling, finally (during World War Two) falling below the level of public debt.

After the time of troubles, public debt (blue) started falling. Private debt (red) started rising. And our economy had a Golden Age.

Graph #2 shows that, after the Golden Age, public debt (blue) fell a little more, then leveled off, and finally started rising. Rising since about 1980. After the Golden Age, private debt (red) continued to rise, then continued to rise, and finally rose until the sudden crisis that occurred just before 2010.

The late peak, just before 2010, I want to compare it to the 1930s peak during the Great Depression. I want to compare the two situations. The two sets of circumstances.

Before the time of the first peak, private debt was high. But then it fell severely. Public debt grew in response to the troubles, and finally public debt rose above the level of private debt. Soon thereafter, the troubles disappeared.

Before the time of the second peak, private debt was high. And it continued to rise without letup. Public debt grew in response to troubles that arose, but private debt continued to grow faster than public debt, Therefore, there was no end of troubles after 1974. There was no end of troubles after 1987. And there is no end of troubles today.

What's different about the two peaks? What's different is the growth of private debt. During the Great Depression, private debt collapsed. But since that time -- since the end of the Second World War -- there has been no collapse of private debt. No collapse until the crisis. Private debt only grew higher.

And if you think of it in simple terms, you can see that the end of troubles for some reason requires public debt to rise above the level of private debt (just as it did in the 1940s).

Well, that was easy to do in the 1940s, for private debt was falling.

Since probably 1966 we have needed public debt to again rise above the level of private debt. But this has been impossible to achieve, because private debt has been rising faster than public debt.

The people who say we need more Federal spending are right, except for one thing. Federal spending has been "more" since 1980 and it has not solved the problem. It has not solved the problem because private debt is not falling.

Private debt is growing faster than public debt. That is what has to change.

You with me?

Wednesday, November 12, 2014

"This was a direct challenge to Keynesian-style fiscal policy and ushered in monetarism."


From my monthly RePEc stats I got to Top 25 Working Papers by File Downloads 2014-10, where the top item was How did we get to where we are now? Reflections on 50 years of macroeconomic and financial econometrics by Michael Wickens.

It's a 53-page PDF; I'll never get to the end of it. I have to say, though, that it is fascinating -- and easy reading, far as I've got. This is from the opening of Section 2: Macroeconomic models:
This procrustean approach to macroeconomic modelling was challenged by a number of undermining analyses that achieved considerable prominence and led to the increased use of small-scale models. One of the first such studies was by Anderson and Jordan (1968) who found that in a simple regression of output on distributed lags of the money supply and government expenditures, it was money that was significant and not government expenditures. This was a direct challenge to Keynesian-style fiscal policy and ushered in monetarism.

So by page eight, I tripped over the sentence that serves as the title of this post, sending me off in search of Anderson and Jordan (1968). I want to know what years Andersen and Jordan studied, that gave them the results they got.

Why? Because the economy changes, that's why.


Anderson and Jordan found that
it was money that was significant
and not government expenditures.


Andersen and Jordan turned up at the St. Louis Fed: Monetary and Fiscal Actions: A Test of Their Relative Importance In Economic Stabilization (PDF, 14 pages).

Andersen and Jordan:

The data are seasonally adjusted quarterly averages for the period from the first quarter of 1952 to the second quarter of 1968.

So, yes: The Andersen & Jordan paper examines the economy's reactions in a brief window at a time when the economy's performance was particularly good.

The irony is that the economy's performance in the 1950s and '60s was particularly good because of the large amount of government expenditures in the 1940s.


Tuesday, November 11, 2014

A few minor changes


From QE’s Seeds are Already Sown by David Howden at bastiat.mises:

When a financial crisis or economic recession hits, it’s almost never because of some event that apparently happened at the same time. The crisis of 2008 did not occur because of the collapse of Lehman Brothers. It happened because the whole financial system and greater economy were fragile following years of cheap credit at the hands of the Greenspan Fed. If anything, Lehman was a result of this and a great (if unfortunate) example of the type of bad business decisions firms are lured into by loose money. It wasn’t the cause of the troubles but a result of them. And if Lehman didn’t go under to spark the credit crunch, some other fragile financial institution would have.

I think that's just about exactly right. If I were to change anything in it, I'd cut out "following years of cheap credit at the hands of the Greenspan Fed" and replace it with something like "because of our unrelenting encouragement of credit use and our failure to encourage repayment of debt."

I don't blame Greenspan; the problematic policy existed long before Greenspan. Anyway, the policy arises from Congress, not from the Fed.

And I don't blame easy credit; credit should be easy. I blame failure to repay, or, the failure of policy to accelerate repayment of debt enough to offset the accelerated use of credit. We borrow faster than we pay back; therefore, debt accumulates.

And it's not that "loose credit" lures people into bad business decisions. Rather, it's accumulating debt that turns good decisions into bad ones.

Monday, November 10, 2014

Money Relative to GDP: Rates of Growth


Graph #1:Percent Change in "Money Relative to GDP" 1916-1970

Graph #2: Percent Change in "Money Relative to GDP" 1970-2014
Click either graph for source page -- Google Sheets for Graph #1, FRED for #2.

On both graphs, base money shown in gold, M2 money in red. Graph #1 shows M1 money (blue) while #2 shows MZM (green).

On both graphs, the different money measures all move together. The money measures all move in the same direction and change at the same time. This generalization appears to be somewhat less true of the second graph than the first. But even on the second graph it is for the most part correct. There are no lags between base money and the other moneys as there are between base money and inflation. Evidently, there are lags between all the moneys, and inflation.

What does this mean?

It means that the metabolism of the economy -- the source of lag -- does not depend on the quantity of money. Or at least, it doesn't always depend on the quantity of money.

This is premature, but I'm tempted to say it depends on the willingness to spend.

Sunday, November 9, 2014

The Volume of Trade in the Time of Charlemagne


From page 97 of John J. Butt's Daily Life in the Age of Charlemagne:
Some historians have seen the main purpose of coins in the eighth and ninth centuries as stored value because many of the coins that have been discovered have been in buried hoarded collections and because many of the Carolingian coins look relatively new and unworn. However, the coins that are discovered are often likely to be ones buried in a hoard. It is less common to find individual coins and unlikely that bog people will be discovered with pockets loaded with coins. Second, Carolingian coins were struck or minted very carefully and very heavily, meaning that the dies for casting were cut deeply. This produced coins with high and sharp relief. Therefore, they often still look in mint condition. These coins were not meant just for the nobility nor as a means for saving value, for they were minted in a number of locations around the kingdom, including Aachen, Amiens, Quentovic, Rheims, Rouen, Paris, Lyon, Strasbourg, Verdun, Melle, Milan, Pavia, Dinant, Maastricht, and Dorestad. Charlemagne tried to consolidate minting to the royal palace at Aachen, but was unsuccessful in doing so.

The existence of so many mints indicates that coins were needed regularly and continuously around the kingdom, and there could be no other purpose than trade that would require such continuous supply of coins. Some historians have suggested that the purpose of coins was for hoarding of treasure or that they were used solely by large-scale merchants, but the number of coins in circulation proves that coinage was primarily for regular trade.

There has been a great deal of debate about the number of coins that were in circulation in the Carolingian Empire. An estimate has been made for the number of coins minted in Mercia (England) under King Offa, a contemporary of Charlemagne, of 6.7 million. Estimates would suggest that the number of coins minted during Charlemagne's reign was considerably larger than this, perhaps several times this. Even 10 million coins would provide numbers far beyond savings of treasure and even beyond use by a few large-scale merchants. Numbers such as these would suggest that many people were using coins on a regular basis for everyday trade.

"Bog people". I like that.

The first paragraph I have no trouble with. Coins are likely to be discovered in hoards. Sure. The coins had sharp relief. Okay. Coins were minted in several places. Fine.

The second and third paragraphs excerpted here are a single paragraph in the original.

"The existence of so many mints," John Butt writes, "indicates that coins were needed regularly and continuously around the kingdom". Maybe. Or maybe it was a sign of prestige to have a mint: Maybe it meant the King liked you better, and every liege lord wanted one. Maybe Charlemagne handed out mints for good behavior.

I'm no historian. I just poke things with a stick. But the reading I've done must have been from works written by some of those "some historians" who said the main purpose of coins was to store value, because I think there was a lot of that in Charlemagne's time. I think Charlemagne tried to stimulate the economy. I think either he changed that trend or he lived at a time when the trend was starting to change. (Or more likely both.) But I think it's incorrect to convey the idea that the volume of trade then was in any sense comparable to trade today. I think John Butt's argument is weak.

Why is it "unlikely that bog people will be discovered with pockets loaded with coins"? Perhaps because those people used coins far less than John Butt says!

I think people have a tendency to interpret things in terms they understand. The economy was different in Charlemagne's time than it is today. I think John Butt is interpreting Charlemagne's economy in modern terms. From long before the fall of Rome, hoarding had been the way of the world. The hoarding mentality was the economic challenge Charlemagne faced. John Butt doesn't see it.

"[T]here could be no other purpose than trade that would require such continuous supply of coins," he says. Certainly there could be other purposes -- hoarding, for one. I have previously quoted the historian Ferdinand Lot:

After the end of the seventh century, the issue of gold coins slowed down and then completely disappeared... In the eighth century even silver money tended to pass out of currency, at least in the Rhine districts, payments being made in grain, cattle, horses, etc., rather than in metal specie.

As coin went out of circulation, it went into hoards. Or it went to other lands. I have previously quoted the historian Marc Bloch:

The life of the Europe of the first feudal age was not entirely self-contained. There was more than one current of exchange between it and the neighbouring civilizations...

Not only was this trade restricted to very few routes; it was also extremely small in volume. What is worse, the balance of trade seems to have been distinctly unfavourable -- at any rate with the East.

The profits of the slave-trade, in general fairly small, were not sufficient to pay for the purchase of precious goods and spices in the markets of the Byzantine world, of Egypt or of nearer Asia. The result was a slow drain of silver and above all of gold. If a few merchants unquestionably owed their prosperity to these remote transactions, society as a whole owed scarcely anything to them except one more reason for being short of specie.

However, money was never wholly absent from business transactions in feudal Europe, even among the peasant classes, and it never ceased to be employed as a standard of exchange. Payments were often made in produce; but the produce was normally valued item by item in such a way that the total of these reckonings corresponded with a stipulated price in pounds, shillings and pence.

The weakness of trade and of monetary circulation had a further consequence of the gravest kind. It reduced to insignificance the social function of wages. The latter requires that the employer should have at his disposal an adequate currency, the source of which is not in danger of drying up at any moment; on the side of the wage-earner it requires the certainty of being able to employ the money thus received in procuring for himself the necessities of life. Both these conditions were absent in the first feudal age.

John Butt says "These coins were not meant just for the nobility nor as a means for saving value... The existence of so many mints indicates that coins were needed regularly and continuously around the kingdom... [T]he number of coins in circulation proves that coinage was primarily for regular trade... [M]any people were using coins on a regular basis for everyday trade."

Marc Bloch says "money was never wholly absent". Bloch says money values were used to measure value in barter exchanges. That's not the same as using coin for "everyday trade". Not by our standards.

If every Harry Serf and his brother were engaged in trade, where did they get the coin? There were no wages. There was no Robin Hood. Oh, there was still trade, sure -- at the top of the heap. Just like today we have asset price inflation while the real economy languishes. Take the trends of our time and run with them for some hundreds of years, and you'll get a feel for the nature and volume of trade in the time of Charlemagne.


Again, John Butt:

The existence of so many mints indicates that coins were needed regularly and continuously around the kingdom, and there could be no other purpose than trade that would require such continuous supply of coins.

Maybe minting of coins was Charlemagne's version of Quantitative Easing. He was trying to restore the economy. He was trying to get money circulating. Like Ben Bernanke, Charlemagne knew that for money to circulate, money had to be made available. So, like Bernanke, he made money available.

If much of that money sat idle in hoards, it must have come as no surprise.

I wonder if they called it "excess reserves" in those days.

Saturday, November 8, 2014

"Europe's Dark Ages ended when Charlemagne came along."


From LiveScience:
How Charlemagne Changed the World
by Heather Whipps

After the break up of the Roman Empire in the late 5th-century, its eastern Byzantine half flourished while the western region disintegrated into a collection of fragmented kingdoms without any central authority.

Europe was entering its fourth century of the "Dark Ages" when Charlemagne was born in A.D. 742, a time marked by frequent warfare, few important cultural achievements and the virtual cessation of learning.

Charlemagne became ruler of one of those kingdoms in Germany in A.D. 768 and immediately set about expanding his territory. Through the course of more than 50 battles, most of which he led in person, he'd conquered almost all of mainland Europe.

Everywhere his rule was established, Charlemagne instituted the same reforms, creating a common identity in people from eastern Germany to southern Spain.

One of the most important changes Charlemagne made was abandoning the gold standard and putting all of Europe on the same silver currency. Trade became easier and the continent prospered, aided by laws that took some power away from the nobles and let the peasantry participate in commerce.

The lower classes benefited in other ways under Charlemagne, who was frustrated with the nobility's sense of entitlement and had deep sympathy for the peasants, according to historians. Among other legislation, all local regional governors were subject to regular inspections by royal emissaries to make sure no injustices were being done.

Educational reform was also high on Charlemagne's agenda. The progressive leader loved to learn, historians say, and so encouraged schooling throughout his kingdom in his chosen lingua franca, Latin.

All of a sudden, not only were the once-fractured regions of Europe connected by peaceful trade networks and common laws, but people could communicate with each other too.

From TheMiddleAges.net:
Charlemagne was the elder son of Pepin the Short... Pepin the Short indulged in the monopoly of the coining of money, deciding on the opening and closure of minting shops, the weight, title and the subjects represented.

European coinage began with Pepin the Short who revived the system put in place by the ancient Greeks and Romans and kept going by the Eastern Roman Empire (1 libra = 20 solidi = 240 denarii).

Pursuing his father's reforms, Charlemagne did away with the monetary system based on the gold sou. Both he and King Offa of Mercia took up the system set in place by Pippin. He set up a new standard, the livre (i.e. pound)— both monetary and unit of weight— which was worth 20 sous (as per the solidus, and later the shilling) or 240 deniers (as per the denari, and eventually the penny). During this period, the livre and the sou were counting units, only the denier was a coin of the realm.

Charlemagne applied the system to much of the European Continent, and Offa's standard was voluntarily adopted by much of England.

After Charlemagne's death, continental coinage degraded and most of Europe resorted to using the continued high quality English coin until about 1100.

From writework.com:
Charlemagne also changed European commerce through the construction of new roads and bridges, and through standardized weights, measures, and tolls. He developed a money economy through the minting of the first silver coin since the Roman Empire's denarius.

Mr. Donn writes:
Standardized Money: Each count appointed tax collectors to collect the yearly taxes. The amount of the tax was set based upon the population. Everyone knew how much tax they owed. But there was a problem. Since most people paid their taxes through barter, the local tax collector could set the value for the barter. Charlemagne came up with a better system. He created silver coins, each with a set value to use instead. Thus a farmer could sell his crops for silver coins and then pay his tax with the silver coins. There was no way to cheat on this. Everyone, especially the peasants, loved the new system.

In Domesday: A Search for the Roots of England, Michael Wood points out that Charlemagne's monetary system -- "12 pennies to the shilling and 20 shillings, or 240 pence, to the pound" -- was in use for 1300 years.


Okay. I thought Charlemagne came from the region we call France, not Germany. And I don't know if Pippin is the same person as Pepin the Short. But now I understand that it was Charlemagne who made the switch from gold coin to silver. I think he put money in a form that was more accessible to more people. Me, I use $20 bills and I'm comfortable with $20 bills. But give me a hundred and you'll stop me cold. Is it real or counterfeit? Will the guy at the Quick-Stop accept it? Should I accept it? I mean it's money, but is it useful? Hundred dollar bills make me hesitate.

I imagine gold coin was useful for bigger purchases, like if you were buying the neighbor's village. But silver coin was more useful for everyday purchases, like if you were buying the neighbor's cow or bringing your vegetables to market.

Gold coin was a money of account -- a money to keep in your counting-house or in your dragon's hoard. People would hesitate to spend it. Silver was a money of exchange. Charlemagne helped to create an economic environment where markets could thrive. The economy started becoming monetary again, and the Dark Age ended, with Charlemagne.

Tomorrow: A look at Page 97 from Daily Life in the Age of Charlemagne.

Friday, November 7, 2014

Until there's nothing left to give


Lawrence Summers:

It is certainly fair to say that growth was adequate perhaps even good during the 2003-2007 period. It would not be right to say either that growth was spectacular or that the economy was overheating during this period. And yet this was the time of vast erosion of credit standards, the biggest housing bubble in a century, the emergence of substantial budget deficits and what many criticize as lax monetary and regulatory policies.


"It is certainly fair to say that growth was adequate perhaps even good during the 2003-2007 period."

Good? He's kidding, right?

Graph #1: Percent Change from Year Ago, Industrial Production

Graph #2: Percent Change from Year Ago, Real GDP


Graph #3: Percent Change from Year Ago, Total U.S. Employment


"And yet this was the time of vast erosion of credit standards, the biggest housing bubble in a century, the emergence of substantial budget deficits and what many criticize as lax monetary and regulatory policies."

Well of course. It was very late in a long financial cycle. And just as the graphs show progressive deterioration, finance demands progressively more from the productive economy, until there's nothing left to give.

Thursday, November 6, 2014

"prior to onset of financial crisis"


Lawrence Summers:

Here it is instructive to consider the performance of the US and Eurozone economies prior to onset of financial crisis in 2007.

If you want to know about the crisis, don't spend all your time looking at the crisis. Spend most of your time looking at the sixty years before the crisis.


If you want to know about the crisis, you have to take all the analysis of the past five decades at least and flush it down the toilet. You have to go back, for example, to the analysis that says the mid-1960s inflation was a "guns and butter" problem, throw it away, and be willing to consider a different explanation.

And everything since.

The difficulty lies, not in the new ideas, but in escaping from the old ones, which ramify, for those brought up as most of us have been, into every corner of our minds.

Wednesday, November 5, 2014

The Annual Adjustment


From Brad DeLong, from Larry Summers


Skip DeLong. Read Summers.

Tuesday, November 4, 2014

Locating a Peak


Wikipedia, Decline of the Roman Empire
The causes and mechanisms of the decline of the Roman Empire are a historical theme that was introduced by historian Edward Gibbon in his 1776 book The Decline and Fall of the Roman Empire...

There is no consensus on a date for the start of the Decline. Gibbon started his account in 98. The year 376 is taken as pivotal by many modern historians. In that year there was an unmanageable influx of Goths and other barbarians into the Balkan provinces, and the situation of the Western Empire generally worsened thereafter, with recoveries being incomplete and temporary.

By these accounts, the peak came early (around year 98) or late (around year 376) in the imperial phase of Roman civilization. That's what I once thought, that the Roman Empire was an advance from the Roman Republic -- though really, the Star Wars story could have shown me the error in my thinking.

Arnold Toynbee showed me my error. Wikipedia:
In contrast with the declining empire theories, historians such as Arnold J. Toynbee and James Burke argue that the Roman Empire itself was a rotten system from its inception, and that the entire Imperial era was one of steady decay of institutions founded in Republican times.

The rise of empire was a solution to the problems of the republic.

Monday, November 3, 2014

That's I-E-S, not I-C-S


"Truly great macroeconomists aspire to explain and understand the fundamentals of modern economies." -- Lars P. Syll

Please note: The great ones study economies, not economics

Study the economy.

Sunday, November 2, 2014

"At the start" versus "Since the first moment"


Endogenous Money: The Evolutionary versus Revolutionary Views
Louis-Philippe Rochon and Sergio Rossi

http://www.csbancari.ch/pubblicazioni/rmelab/rossi2.pdf

Page 8 of 17:
Every bank note corresponds as a matter of fact to a double-entry in the books of the issuing bank, a record of which the note is the material representation circulating outside the bank issuing it. As Innes (1913, p. 407) cogently pointed out in this respect, “[a] bank note differs in no essential way from an entry in the deposit register of a bank. Just like such an entry, it is an acknowledgment of the banker’s indebtedness [...]. The only difference between a deposit entry and a bank note is that the one is written in a book and the other is on a loose leaf; the one is an acknowledgment standing in the name of the depositor, the other in the name of ‘the bearer.’” This is a point that Courbis et al. (1991, p. 329) very clearly illustrate referring to British monetary history, particularly at the time of the first goldsmiths in London, around 1660–65. The authors (pp. 324–5) are also clear in noting that book-entry payments existed long before bank notes or their ancestors, say a goldsmith’s certificates, appeared on earth. Indeed, “[t]here is little doubt that money had existed for at least 3000 years before coins were struck, taking a wide variety of forms”(Wray, 2004, p. 235).

Money had existed for at least three thousand years before coins were struck.

I can buy that. Money arose and became part of the culture first, and governments adopted it later. Sure, why not? That's a politician's idea of leadership, right?


Rochon and Rossi, page 3 of 17:
The purpose of this paper is therefore to shed further light on the endogenous nature of money. Contrary to the established post-Keynesian perspective – what we call here the evolutionary view – we argue that money has always been endogenous, irrespective of the historical period. This discussion may be important for both theoretical and policy reasons, a point that we address later in the paper. Overall, however, showing that money has always been endogenous is important in particular for post-Keynesians, since it will help to put the role of central banks and other monetary institutions, as well as financial innovations, in their proper theoretical perspective.

Money has always been endogenous.

Money may have arisen spontaneously, say, some 3000 years before coin. That means money was endogenous at the start. It does not necessarily mean money has been endogenous since the start.

It does not mean that money has always been endogenous.

It's a weak argument to claim that money is always endogenous because it started out endogenous. When governments adopted it, money took on a dual role, endogenous and exogenous. Ever since, private sectors have been struggling with governments over money.

When a government assigns a name to a unit of value -- "the dollar", for example -- they create a standard for the private sector to nibble away at, just as a thousand years ago we were nibbling gold off the edges of coins before passing them along.

When the nibbled coins got generally unacceptable there would be a "recoinage". New, full-bodied coins were issued, and the nibbling would start again. But the government lost gold in the process. Eventually, you would expect to see the government fail.

Today we've taken the gold out of money. Nibbling has taken a different form. But the essential, underlying process is the same: Everybody tries to do better for himself, at the expense of others; and governments ultimately fail. In that process, for better or worse, endogeneity wins out over exogeneity.

That's why, when you look at the world today, you see endogenous money and a failing dollar.


Endogeneity of Money
by Hyman P. Minsky, 1990.

http://digitalcommons.bard.edu/cgi/viewcontent.cgi?article=1429&context=hm_archive

Page 3 of 9:
There are periods in history and economic conditions where the money supply was mainly endogenous and other periods and conditions where the money supply was largely exogenous... Typically the money supply is in part endogenous and in part exogenous.


Saturday, November 1, 2014

Yves is right: Don't dwell on the Monetarism


I see what looks like the whole of Walker Todd's Fed needs to stop asset acquisitions for a generation or so has now appeared at Naked Capitalism, prompting me to respond to it sooner than I had intended. Here's the opening at Naked Capitalism:

Yves here. Readers will take issue with some of former Fed staffer and banking expert Walker Todd’s comments on monetarism and Fed policy, but he nevertheless reaches the right general conclusions.

I don't agree that Walker Todd reaches the right conclusions. I think his analysis is incomplete. His conclusions are premature and must be set aside while the analysis proceeds.


At Free Banking:
The Federal Open Market Committee (FOMC) meeting that ended today (Oct. 29) marked the first chance for the FOMC finally to do the right thing since the onset of the great financial crisis in the late summer of 2008. That right thing consists of resolving not to add even another dollar to the Federal Reserve System's balance sheet for at least the next ten years (and perhaps as long as 30 years) in the absence of officially declared war or national emergency...

In 2007, the year before the crisis, a Fed balance sheet of "only" $929 billion sufficed to promote strong growth in a $14.5 trillion economy (nominal GDP). The Fed's balance sheet was only 6.3 percent of the entire economy. After countless interventions in the economy and a never-ending series of Quantitative Easings (econospeak for money-printing) since then, the Fed's balance sheet is nearly five times larger, but the economy is only 19.3 percent larger. The Fed's balance sheet is now 25.5 percent of GDP.

Finally, if one wished to reduce the Fed's role in the economy to the level that prevailed before the crisis, about 6.5 percent of GDP (the range was 5.9 to 6.9 percent over the preceding eleven years), the current size of the Fed's balance sheet would support economic expansion to nominal GDP of $67.9 trillion, about four times the current size of GDP. Historically, it took 15 years for GDP to quadruple, 1969-1984, and that period included the high-inflation 1970s. In a period of lower inflation, after 1984, it took 28 years for GDP to quadruple again in 2012.

I'm not sure why Walker Todd thinks it might be smart to reduce "the Fed's role in the economy" down to what it was a year before the crisis. It seems to me, without knowing anything, that the Fed's role could have been too small at that time, and this could have been the cause of the ensuing problems.

I'm not claiming that's the case. I'm saying that, not knowing anything, one can still see the obvious connection between the Fed's low level of holdings in the years leading up to the crisis, and the Fed's dramatic increase of those holdings in response to the crisis. Frankly, it looks as if the Fed thought that its small pre-crisis position was part of the problem, and that enlarging its position was most of the solution.

Correlation is not causality, I know. But look: first the low level leading up to the crisis, and then the dramatic increase in response to the crisis. It doesn't necessarily mean that the Fed should maintain a high participation from now on as permanent policy; but it certainly does mean we ought to be pondering the thought. Walker Todd is not pondering it. He just wants to get back to the good old days when we were only months away from severe economic crisis.


The Fed's balance sheet as a share of GDP was 6.3% in 2007, Mr. Todd says, and now it is 25.5% of GDP. I got wondering about that. He doesn't tell me much. So I went looking.

It didn't take long to find something. This is from the Wall Street Journal, in Real Time Economics from March of last year:


Mr. Todd is looking only at the rightmost half-inch of the data shown on this graph. As I said: His analysis is incomplete. For starters, I have two questions. I provide brief answers, but you might want to expand on them for yourself.

Q: When was the economy good?

A: Golden Age, 1947-1973 or so. When the Fed's balance sheet was high as a percent of GDP, high and falling.

Q: When does the Fed's balance sheet increase dramatically as a percent of GDP?

A: During severe crises: economic depressions and world wars.

Maybe the problems in our economy have to do with the Fed's balance sheet being too low. Maybe it's time to ponder this.


Look. Some people worry that the Fed's expanded balance sheet will lead to inflation. The thing that concerns them is that the spending and the money supply may expand in proportion.

If and when that happens, it will happen (as you know) along with expanding debt, because debt creation is the method we use to expand the money supply.

If and when debt expands, we'll being going in the wrong direction again. Yeah, we could get inflation from it, if the expansion is rapid enough. But besides that, we'd get more debt from it. And that's the real problem.

Here's my plan: Keep the Fed's balance sheet big. But reduce the amount of debt that can be piled on top of each dollar of base. That's an easy way to minimize the threat of inflation and an easy way to minimize the potential damage arising from the Fed's expanded balance sheet. Yeah we have to somehow get those reserves out into the economy where they can provide an interest-free alternative to the expansion of credit use. But that's not the big problem.

Okay. Leave the Fed's balance sheet big. Eliminate the threat of inflation by eliminating the possibility of debt expanding to sixty times the Fed's balance sheet. We don't want that ever to happen again.

The Fed's balance sheet is four times as big? Let accumulated debt be only one-quarter as big. One quarter of 60 is 15. So it's okay to let accumulated debt expand to 15 times the Fed's balance sheet, and no more.

Then, assuming we get those reserves out into the economy, we have just as much money in the economy (relative to GDP) as we had before the crisis, so no inflation threat. But we have only one-quarter the debt we had before. Only one-quarter the bills to pay. I don't know about you, but that would free up my spending power.