Saturday, February 28, 2015

Long story


A month ago, back at the end of January, my Blogger Preview display suddenly picked up a huge delay. Like, fifty little alligators. It's no longer useable. I griped about it, briefly, figuring it would go away. But it hasn't. I just no longer use it.


Last night I was pretty sad about the passing of Leonard Nimoy. I spent a couple hours reading news articles and looking for an image or two to put up on the blog. Around 8PM I settled on two images, uploaded them to the blog, and posted the thing.

Felt a little better then. (Not much, but a little. It was like mourning-time. I swear, I think Nimoy's passing affected me more than the assassination of JFK.)

Thankfully, Spock lives on.

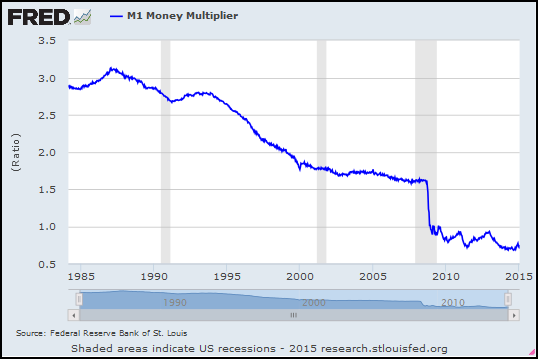
Anyway, this morning between three and four AM -- the puppy has to go out at all hours, so I'm awake -- I came up with an interesting FRED graph. I tried to prepare a new post to display the graph. But I couldn't get the image to load.

Basically, what happened was this: Everything worked, right up until the end when I had to click OK to complete the last step and load the image.


The OK button just wouldn't work. The button depressed and popped back up, but nothing happened.

Of course, the CANCEL button worked fine.

That was four o'clock this morning.

I googled the problem. Somebody had a similar problem a year ago. And, you know, the responses were typical. They want to know what browser you're using, and what operating system, like you're some kind of idiot.

The thing worked at 8PM, and then it didn't work at 4AM. Don't ask me stupid questions. Check to see if somebody was working on the image-upload code, and check to see if they screwed it up. Don't bullshit me.

So I read a bunch of the follow-up comments. And it seemed that maybe if I switched from Firefox to Chrome the problem would go away. Okay.

First I tried "refreshing" Firefox. That was quick and easy and it didn't work. So then I downloaded Chrome. You know: the Google product. You trust Google, right? I did. That was my mistake.

I was just ever so slightly careless playing 20 questions, no I don't want to download this, no I don't want to download that, I just want Chrome. But then there was a message about fixing errors in Windows, and I said yeah, okay. That was my mistake.

I installed Reimage Repair
That was my mistake

The damned thing wasn't even done loading yet, and I got three flashing windows with warnings about other problems and offers to download other wonderful things.

I shut it down. Pressed the power button and kept it pressed till the thing shut down.

Turned it back on after a minute and started the browser, and those three flashing windows came back again.

I shut it down and started up in Safe Mode. Somehow I remembered pressing F8 gives me safe mode. In safe mode the help came up. It said I could try System Restore. So I clicked it.

After a few moments I clicked it again. Then a window came up that said System Restore is already running. But there was no evidence that System Restore was running. So I didn't know if it was true or if it was Reimage Repair messing with my head. I tried a few more times and got the same message. Then I took the puppy out again.

When I came back, the System Restore window was open. It recommended I guess the most recent restore point, 5 AM this morning, which was from just before a Windows Update. I said Okay. I gave it a few minutes.

When I came back, that friggin Reimage Repair was out of my system. And everything was working -- except, of course, Blogger's image upload thing. So I figured I'd write this story.


Turns out, before I was done writing, the image upload started working again. So that's how you got to see the "Choose a Layout" form above... and that's how you get to see the puppy again:

Lexi naps on the couch

Oh, and Jesus! Don't trust Chrome and don't trust Google any more. It's a sad day.

Thankfully, Spock lives on.

Friday, February 27, 2015

Live long and prosper


I think cyclical


There are two ways of looking at the economy.

One way is to see it as a barrel full of loose ends and disconnected acts. The other is to see the economy's behavior as cyclical. When I read Ferdinand Lot --
In the seventh century, the right of coinage, the royal prerogative par excellence, passed over to the episcopal or monastic churches or to private persons; the treasury perhaps still collected part of the profits of coining. Mints multiplied in the cities, "chateau" (castra), vici, and even mere villas. The history of the coinage shows in a striking fashion the disintegration of the royal power.
I think Fall of Rome. Decentralization of power. Dark Age. I think those who don't learn from history are doomed to repeat it. I think cyclical.

When I read JP Koning --
Let's gradually privatize the issuance of paper currency. If anyone can make cash relevant again, it's innovators in the private sector.
Koning sees the world as loose ends and disconnected acts. I think Fall of Rome...

Thursday, February 26, 2015

Burping it up again

This is an old one, from 7 September 2014. I think it's good, and worth repeating.

Let's draw a conclusion


At FRED Blog: How much money is the Fed printing?

To answer that question they look at currency in circulation. Two graphs.

First graph:

Graph #1: Quantity of Money, in Natural Log Values
Before 1960, flat. After 1960, straight-line increase.

The graph uses natural log values to show growth rates. As the FRED post says, "if the slope is the same for two years, the growth rate is the same." A more upward slope is faster growth. A less upward slope is slower growth.

The FRED post says the values are "indeed increasing, but there is no indication that it is accelerating". In other words: The line goes up, yes, but after the early 1960s it doesn't curve up.

Second graph:

Graph #2: Quantity of Money Relative to GDP
Graph #2 shows the same money as Graph #1 but shows it a different way. No "log" numbers. Instead, the graph compares the quantity of money to GDP. On Graph #2 we have downtrend to about 1985, and then uptrend: The currency component of M1 grew more slowly than GDP in the early years, and more quickly than GDP in the late years. I want to say the change occured around 1985.

Leave out the years before 1960 where Graph #1 has the flat trend. Look at the years since 1960, where #1 shows a straight-line uptrend.

From 1960 to 1985 the trend is down on Graph #2. After 1985 the trend is up. And yet, as the FRED Blog says, Graph #1 shows no acceleration.

Graph #1 shows that currency growth did not change. Graph #2 shows that either currency growth or GDP growth did change. We have to put the two facts together in our head: Either currency growth or GDP growth did change, but currency growth did not change. Therefore, GDP growth changed.

Voila.


To confirm, I took a quick look at the numbers.

During the 25 years from 1960 to 1985, currency in circulation increased by a factor of 5.6. During the 25 years from 1985 to 2010, currency in circulation increased by a factor of 5.5. Almost exactly the same. So, a straight line increase it is. As FRED said.

During the first 25 years GDP increased by a factor of 8.0. That's faster than currency growth, so the line on Graph #2 goes down between 1960 and 1985.

During the second 25 years GDP increased by a factor of 3.4. That's slower than currency growth, so the line on Graph #2 goes up between 1985 and 2010.

Currency growth was the same for the two periods, even though the "Great Inflation" is entirely contained in the earlier period. Currency growth was the same, but GDP growth was different. GDP growth was much faster in the early period, and much slower in the second.

Tuesday, February 24, 2015

Labor and Nonlabor Costs


The best match I could find is for nonfinancial corporations -- unit labor costs and unit nonlabor costs for nonfinancial corporations. These two series:

Graph #1: Unit Labor Costs (red) and Unit Nonlabor Costs (blue)

BLS points out that

Unit nonlabor costs include consumption of fixed capital, taxes on production and imports less subsidies, net interest and miscellaneous payments, and business current transfer payments.

Both data series are indexed to 2009=100. That's why the two lines meet in 2009 on Graph #1. And that's why their ratio has the value 1.0 in 2009, on Graph #2:

Graph #2: Unit Labor Costs relative to Unit Nonlabor Costs
Graph #2 shows Unit Labor Costs falling relative to Unit Nonlabor Costs. It's all downhill. By the end, labor costs are about half what they were at the start -- as compared to nonlabor costs.

That's pretty outrageous, I think, especially considering that "Economists view increases in unit labor costs as an important indicator of potential inflation."

Monday, February 23, 2015

Excellent! Excellent!


Michael Hudson, “How economic theory came to ignore the role of debt”, real-world economics review, issue no. 57, 6 September 2011, pp. 2-24, http://www.paecon.net/PAEReview/issue57/Hudson57.pdf

A credit-based theory of pricing would start with the perception that debt service represents a rising share of the cost of producing and distributing goods and services.

Excellent!

No meaningful analysis of demand – or of the degree to which Say’s Law applies – can be drawn up without taking the volume of debt service into account.

Excellent!

Michael Hudson, “How economic theory came to ignore the role of debt”, real-world economics review, issue no. 57, 6 September 2011, pp. 2-24, http://www.paecon.net/PAEReview/issue57/Hudson57.pdf

Sunday, February 22, 2015

On the decline of international competitiveness


From Michael Hudson's How economic theory came to ignore the role of debt (PDF, 23 pages):
An important predecessor of Adam Smith, the merchant Mathew Decker, emigrated from Holland to settle in London in 1702. In the preface to his influential Essay on the Causes of the Decline of the Foreign Trade, published in 1744, he attributed the deterioration in Britain’s international competitiveness to the taxes levied to carry the interest charges on its public debt. These taxes threatened to price its exports out of world markets by imposing a “prodigious artificial Value . . . upon our Goods to the hindrance of their Sale abroad.” Taxes on food and other essentials pushed up the subsistence wage level that employers were obliged to pay, and hence the prices they had to charge as compared to those of less debt-ridden nations.

The cost of finance, in other words, drove up taxes, which drove up the cost of non-financial goods and services. This pushed up "subsistence wages" at home and reduced competitiveness in foreign markets.

Mathew Decker had in mind the costs associated with public debt. But all debt has costs that similarly affect prices at home and abroad.

Thursday, February 19, 2015

Rousseau & Wachtel, 2008


Rousseau & Wachtel:

Since the 1990s, a burgeoning empirical literature has illustrated the importance of financial sector development for economic growth. Despite the growing consensus, however, we find that the link between finance and growth in cross-country panel data has weakened considerably over time. At the very time that financial sector liberalization spread around the world, the influence of financial sector development on economic growth has diminished.

Wednesday, February 18, 2015

It's not that complicated


The Real Effects of Debt, PDF, 34 pages, by Stephen G Cecchetti, M S Mohanty and Fabrizio Zampolli, 2011. They evaluate government debt and non-financial corporate debt and household debt. The opening sentences of the Abstract:

At moderate levels, debt improves welfare and enhances growth. But high levels can be damaging. When does debt go from good to bad?

Dammit, no. Debt is not a flashing light that sometimes flashes red and other times green. Debt is always bad, period. Debt is the cost that is associated with credit use. Credit use is always good, and debt is always bad.

You may want to finesse that a bit, and say credit use is sometimes good and sometimes bad, and I won't argue with you. But please understand: I'm saying it my way to emphasize a point. Credit-use is demand. Credit-use is spending, and spending is demand. But credit-use doesn't cost anything, while it's still just credit-use. It's like getting stuff for free. That's why it's good. That's why it boosts the economy.

But then, a month or so after you use the credit, you get the bill. Now it's not credit-use anymore. Now it is debt. And now it's like paying for something, without getting anything. That's why debt is always bad.

Don't argue with me, dammit, I'm trying to make an idea simple.

In the PDF they say moderate levels of debt improve growth. But that's wrong. It's the credit-use that improves growth, because credit-use is demand. It's debt that harms growth, because the payment is disconnected from demand, and with debt there is payment but no demand.

Moderate levels of debt improve growth? Not really. Moderate levels of debt harm the economy less than high levels of debt. Moderate debt is easier to bear, because moderate credit-use can balance against it. When you have high levels of debt, it takes high levels of credit-use to offset the drag from the debt.

To understand debt, keep three principles in mind: Debt always hurts the economy. Credit-use always helps the economy. And credit-use always creates debt.

Tuesday, February 17, 2015

Credit use is good for growth but accumulated debt is not, so the effect is non-linear


VOX: Financial development and output growth in developing Asia and Latin America: A comparative sectoral analysis by Joshua Aizenman, Yothin Jinjarak, & Donghyun Park:
The Global Crisis put to the fore the possibility that the relationship between financial depth and output growth may be non-linear – the development of the financial sector may benefit the real sector, but only up to a point.1 Beyond that point, further financial development may have no effect or even a negative effect on growth.

The evidence suggests that the level of service flow of financial sector is good only up to a point, after which it becomes a drag on sectoral growth in the sample countries.

Overall, our evidence is consistent with the hypotheses we set forth at the outset, in particular the non-linear effect of financial development on growth and its uneven effect across sectors. In addition, we find that financial depth has a negative effect on manufacturing in East Asia and a positive effect on finance, insurance, and real estate sector in Latin America. Financial efficiency, as measured by lending-deposit interest spread, is positively associated with the growth of finance, insurance, and real estate sector... We also find some evidence of a financial Dutch disease – the faster the growth of financial services and the larger the lending-deposit interest spread, the slower the growth of the manufacturing sector.

Footnotes

1 Boyd and Smith (1992) show that the quality of financial intermediation has first-order effects on capital flows and economic growth, providing a nice interpretation to the Lucas paradox (1992) of capital flowing uphill, a topic that gained even more attention in the context of the global imbalances in the 2000s (see Laura et al. 2003, Ju and Wei 2011 and the references therein). Cecchetti and Kharroubi (2012) study how financial development affects growth at both the country and industry level. They find the level of financial development is good only up to a point, after which it becomes a drag on growth. These results are in line with Rousseau and Wachtel (2011)’s ‘vanishing effect’ – i.e. credit has no statistically significant impact on GDP growth over the 1965-2004 period. Looking at the more recent data, Philippon and Reshef (2013) concluded that at the very high end of financial development, rapidly diminishing social returns may have set in. Aizenman et al. (2013) found that periods of accelerated growth of the financial sector are more likely to be followed by abrupt financial contractions than are periods of slower financial sector growth. Though these studies do not identify the mechanisms associated with the ‘vanishing effect’ of finance, they are consistent with Minsky (1974)’s hypothesis over time that financial deepening may eventually divert financial resources from financing real activities into speculative and ultimately destabilising risky and bubbly yield-seeking financial investments.

Nonlinear? Sure.

The part I like best? Rousseau and Wachtel in the footnote: credit has no statistically significant impact on GDP growth over the 1965-2004 period.

Yeah. Accumulated debt has been excessive since 1965? Yeah.

From the list of references: Rousseau, P, and P Wachtel (2011), “What is Happening to The Impact of Financial Deepening on Economic Growth?” Economic Inquiry, 49, 276-288.

Monday, February 16, 2015

The Mortgage Forgiveness Debt Relief Act and Debt Cancellation


IRS: The Mortgage Forgiveness Debt Relief Act and Debt Cancellation:
If you owe a debt to someone else and they cancel or forgive that debt, the canceled amount may be taxable...

If you borrow money and the lender later cancels or forgives the debt, you may have to include the cancelled amount in income for tax purposes, depending on the circumstances. When you borrowed the money you were not required to include the loan proceeds in income because you had an obligation to repay the lender. When that obligation is subsequently forgiven, the amount you received as loan proceeds is normally reportable as income because you no longer have an obligation to repay the lender.

I have to say the last couple sentences there make perfect sense. A loan doesn't count as income because I have to repay it. So then, if it turns out I don't have to repay it, I guess it does have to count as income.

Here's what doesn't make sense. It doesn't make sense when everything that happens in the economy drives people to use more and more debt, until suddenly debt breaks the camel's back and the economy practically shuts down. It doesn't make sense to push accumulated debt to such a high level that the economy can no longer even grow, and then turn around and say you have to pay income tax on any debt that's forgiven. That makes no sense.

Sunday, February 15, 2015

Victor Ehrenberg: From Solon to Socrates


From my old notes, excerpts out of From Solon to Socrates: Greek History and Civilization during the sixth and fifth centuries B.C. by Victor Ehrenberg. London: Methuen & Co. Ltd., 1968.

From the introductory material...
The period between Solon and Socrates includes the sixth and fifth centuries [B.C.], that is to say, the culmination and the end of the archaic age, and the finest flowering of the classical age. I do not include the fourth century, in spite of Plato and Praxiteles, because of the decline and change in politics during that period.

Solon was a poet and a statesman; he is the first Greek politician who still speaks to us....

With [Socrates] one epoch ends, and another begins. His execution was the first unforgivable crime of the restored democracy, which traced its origins back to Solon.

The two men [Solon and Socrates], neither of them an extremist, tried to create new bonds between the extremes in society....
 
Notes on Solon:
From Hesiod onward oppression and injustice were causes of growing complaint.

The community needed a stronger supreme authority, a unified domestic and foreign policy, and above all social peace and economic prosperity. In various cities the opportunity was seized by individual leaders, strong personalities who gained power by usurpation. The Greeks called them 'tyrants'....

Athenian pottery had flourished in the ninth and eighth centuries; after that there is no evidence that Athens was of importance till the time of Solon.

The nobility were the large landowners, mainly corn-growers and to some extent cattle-breeders, later cultivators of olives and vines.... These wealthy families were a clear minority of the people, but they held most of the fertile land in the Attic plains, while the small farmers generally lived on the poorer land in the hills.

The nobility, firmly entrenched in the security of their political power and their bonds of kinship, cult, and neighbourhood, and so far not yet seriously affected by the slow rise of the peasantry, were to face an economic and social crisis which not only undermined their own power but also severely shook the whole community....

The enmities among the noble families and the blood-bath that ended the Cylonian affair were symptoms rather than causes of general conditions otherwise hardly known to us.... 'After that,' Aristotle writes, 'there was for a long time civic struggle between the nobles and the people.'

In general, the lower classes were in a sorry plight; what their situation exactly was depends on some facts which cannot be regarded as clearly established. One thing we do know is that down to Solon, money economy hardly began to exert any influence at Athens. It was a question of land and its produce.

Solon seems to have given a law to prevent the unlimited accumulation of land....

...the fact that the plight of the peasantry was so widespread, and also that Athens did not send out colonies, makes it likely that there was no bar to dividing the ordinary lot, except that it may frequently have been too small for further division. Thus the number of very small farms would increase and make it more likely that so many peasants fell into debt.

Aristotle maintains that loans were on the security of the persons of the debtor and his family. Sale into slavery was the ultimate consequence of that rule.

When a peasant tried to get help from a wealthy neighbour, it was quite common, as Solon expressly states, for the rich to make the most unfair use of their opportunities. Solon reproached them for 'avarice and arrogance', thus condemning on moral grounds what, he knows, was at the same time a grave social danger.

Solon was elected archon for the year 594-593 and was given full power. The foremost thing he did was to free the debtors and their land. He did this by cancelling all debts, and this was called seisachtheia, the 'shaking off of burdens'. It certainly was a radical measure, but the loss for the creditors did not touch the substance of their wealth. At the same time he forbade for the future all loans on the security of the person so that never again could a man, or his wife and family, be enslaved for debt. It is possible that he cancelled thereby a law of Dracon's....

Solon was a man of the middle road. That will have been a trend of his nature, but it was also the result of a reasoned approach to politics rather than an a priori principle. Solon learnt the wisdom that 'in great things it is hard to please everybody'. He proudly claimed, 'To the demos I have given such honour as is sufficient, neither taking away nor granting them more. For those who had power and were great in riches, I equally cared that they should suffer nothing wrong. Thus I stood, holding my strong shield over both, and I did not allow either side to prevail over justice.'

Saturday, February 14, 2015

Greece, now and then


Article 50 of the Consolidated Treaty on European Union:
1. Any Member State may decide to withdraw from the Union in accordance with its own constitutional requirements.

2. A Member State which decides to withdraw shall notify the European Council of its intention. In the light of the guidelines provided by the European Council, the Union shall negotiate and conclude an agreement with that State, setting out the arrangements for its withdrawal, taking account of the framework for its future relationship with the Union. That agreement shall be negotiated in accordance with Article 218(3) of the Treaty on the Functioning of the European Union. It shall be concluded on behalf of the Union by the Council, acting by a qualified majority, after obtaining the consent of the European Parliament.

3. The Treaties shall cease to apply to the State in question from the date of entry into force of the withdrawal agreement or, failing that, two years after the notification referred to in paragraph 2, unless the European Council, in agreement with the Member State concerned, unanimously decides to extend this period.

4. For the purposes of paragraphs 2 and 3, the member of the European Council or of the Council representing the withdrawing Member State shall not participate in the discussions of the European Council or Council or in decisions concerning it.

A qualified majority shall be defined in accordance with Article 238(3)(b) of the Treaty on the Functioning of the European Union.

5. If a State which has withdrawn from the Union asks to rejoin, its request shall be subject to the procedure referred to in Article 49.

Here are three points made by Article 50:

--> The EU shall set out the arrangements for a member state's withdrawal

--> The withdrawal agreement shall be negotiated by the Council, after obtaining the consent of the European Parliament. In other words, if the Parliament does not consent, there can be no withdrawal agreement and evidently no withdrawal.

--> "The Treaties shall cease to apply to the State in question" -- that is, the withdrawing state is no longer a member of the EU -- as soon as the withdrawal agreement takes effect, or, "failing that", two years after the state notifies the union of its intent to withdraw, unless the European Council decides to extend this period.


Wikipedia, Delian League:


Encarta 96, Delian League:
Delian League, federation of city-states of ancient Greece, whose main purpose at the time was to prepare against a possible renewal of aggression by Persia. The league, sometimes called Confederation of Delos, was founded in 478 BC after the failure of a Persian attempt to invade Greece. Because it appeared probable that Persian aggression might come by sea rather than by land, Athens, as the greatest sea power in Greece, became the leading member of the league.

The confederation had its headquarters on the island of Delos, and each of the member states, which at one time numbered more than 200, made a contribution in manpower and equipment in proportion to its resources. As time passed, fewer of the allies in the league contributed men and ships, most of them substituting money payments, which became in effect tribute to Athens. As this trend continued, the program of the league gradually changed from one of defense against Persia to that of strengthening Athens. When several members were restrained by force from seceding, the alliance of sovereign states was transformed into what modern scholars call the Athenian Empire.

Wikipedia, Greco-Persian Wars
The allies of Athens were not released from their obligations to provide either money or ships, despite the cessation of hostilities.

H.G. Wells, The Outline of History:
And it was chiefly the poorer citizens of Athens who sustained this empire by their most vigorous and incessant personal service. Every citizen was liable to military service at home or abroad between the ages of eighteen and sixty, sometimes on purely Athenian affairs and sometimes in defence of the cities of the Empire whose citizens had bought themselves off.

Friday, February 13, 2015

Your choice


You can dismiss this graph because it shows something called the money multiplier,

Graph #1: The Money Multiplier
or you can look at the damn thing and see what you can discover. Your choice.

Here's what I might do: Put a line on the graph.

Graph #2: The Red Line shows the Low Edge of a Trend Channel
My red line, just by eye, shows the trend of the first few years after the January 1987 peak in the multiplier. Remarkably, that same red line makes a good fit to the lows of the blue line, 20 years later.

Midway between those two periods, the blue line runs very close to the red for a good four years, punching thru it just once, at the end of 1999.

It is as if something set a minimum, a downtrending boundary below which the money multiplier could not fall, except by waiting for the passage of time to push that boundary lower. An interesting notion. But there is more.

There are stories, there must be stories behind those disturbances where the blue line runs up and away from the red -- in the early 1990s, then again in the 2000s -- and returns to the red line, once gradually, once suddenly. There must be stories.

The sudden return to red in the midst of the 2009 recession, that's crisis-related. Bernanke-related. That's an obvious one. But how about the eight years before that sudden drop? That is almost the whole decade of the 2000s, and all that time the money multiplier was running nearly flat. There was a stiff resistance to downtrend in the multiplier at that time. Now that's interesting. And that was during the Bush years.

Explain?

That's the second of the two disturbances. The other, the first, begins just after the 1990 recession, peaks at the end of 1993, and returns to red by around mid-1997. Can you explain this one? I think I can.

The blue trend away from red -- from early 1991 to late 1993 -- matches up with a unique downtrend in the debt-per-dollar (DPD) ratio. And the blue return to red -- from late 1993 to mid-1997 and then further, to the end of 1999 -- matches up with the return-to-trend of the DPD.

I went back and started with the blue line again, the money multiplier from Graph #1. I added my debt-per-dollar ratio in green.

Graph #3: The Money Multiplier (blue) and Total Debt per Dollar (green)

Both of these ratios use FRED's M1SL data series. This may account for some of the similarity that will soon become apparent. The blue line divides M1SL by the monetary base AMBSL. The green line divides accumulated public and private debt, TCMDO, by M1SL.

Next I eyeballed two trend lines -- red for the money multiplier, and black for debt-per-dollar.

Graph #4: The Multiplier and DPD with Trend Lines
On Graph #4, between the years 1990 and 2000 you see the disturbance where the blue line moves away from the red, and then gradually returns. This is the disturbance noted above, that I said I can explain.

For the same 1990-2000 period, you can see a disturbance where the green line moves away from the black, and then gradually returns. These two disturbances, the blue and the green, occur at the same time and display similar shapes. Except the one is the mirror opposite of the other.

I took Graph #4 and highlighted the disturbance areas:

Graph #5: The Multiplier and DPD with the Disturbances Highlighted
I think that's pretty interesting.

What does it mean? I don't know. But I don't need to know what it means, today. I never looked at the money multiplier this way, before today. I don't want to jump to any conclusions.

We have the beginning years, the middle years, and the ending years of the money multiplier all fitting themselves to that down-trending red line. And we have explained the first disturbance, the disturbance of the 1990s. All that remains is the second disturbance, the Bush years disturbance. Oh, but you were going to explain that one.

But hey, it's the money multiplier we're looking at here, so maybe you should just dismiss it.

It's your choice.

Thursday, February 12, 2015

What would you do?


The money multiplier:

Graph #1: The FRED series MULT, the Money Multiplier
People say there's no such thing as the money multiplier. But of course there is. I just showed it to you.

It goes down.


On their NOTES tab, FRED says "The M1 multiplier is the ratio of M1 to the St. Louis Adjusted Monetary Base." There is a data series for M1, and there is a series for the Base, and we can divide the one by the other to get the ratio. Doing that, the ratio goes farther back in time than the mid-1980s:

Graph #2: The Money Multiplier, going back to 1959
It still goes down. It goes down from 1959 to the mid-1980s, jumps up just a bit, and then wanders downhill more rapidly than before.

It's not what you'd call stable. If you were the Fed, you could put a dollar into the economy and see it become $3.50 or so -- but that worked only briefly in the 1960s. Your dollar would have become $3 if you did it sometime in the 1970s. $2.50, briefly, in the mid-90s, then $2 around the year 2000, and then a little over a buck and a half, just before the crisis.

Then it dropped straight down to the 1.0 level, where the Fed adding a dollar to the economy resulted in no further increase at all. And now it is below 1.0, so that when the Fed adds a dollar to the economy, only about 75 cents actually makes it into the economy. The monetary multiplier has fallen to less than one.


People argue about the fiscal multiplier and whether it's greater than one. People who favor government spending say yes. People who oppose government spending say no. They argue, I guess, because there's no clear evidence.

But there is clear evidence for the monetary multiplier, and it is clearly less than one. Monetary stimulus, in other words, is most definitely not working. The money multiplier is less than one.

Okay, so we know that monetary policy is not working. But there is no clear evidence regarding fiscal policy. What should we do? What would you do? I know what policymakers do: They rely on monetary policy, because the fiscal multiplier is low.

Wednesday, February 11, 2015

Arnold J. Toynbee on the big endogenous social cycle


From the Somervell abridgement of A Study of History:
In studying the growths of civilizations we found that they could be analysed into successions of performances of the drama of challenge-and-response and that the reason why one performance followed another was because each of the responses was not only successful in answering the particular challenge by which it had been evoked but was also instrumental in provoking a fresh challenge, which arose each time out of the new situation that the successful response had brought about.

... This repetitiveness or recurrency of challenge is likewise implied in the concept of disintegration, but in this case the responses fail. In consequence, instead of a series of challenges each different in character from a predecessor which has been successfully met and relegated to past history, we have the same challenge presented again and again.... When the outcome of each successive encounter is not victory but defeat, the unanswered challenge can never be disposed of, and is bound to present itself again and again until it either receives some tardy and imperfect answer or else brings about the destruction of the society which has shown itself inveterately incapable of responding to it effectively.


Tuesday, February 10, 2015

Callahan and Hoffmann on endogenous social cycles


Via La Bocca della Verità, the SSRN download page for Gene Callahan and Andreas Hoffman's Two-Population Social Cycle Theories. From the Abstract:

Discerning family resemblances in the world of theories can be useful for several reasons. For one thing, noticing that two theories share the traits of a family of theories may help us to understand each of them better. Secondly, noticing the family resemblances may help us to model them more easily... In this paper, we note the large family of two-population social cycle theories, all based on a pattern of disruptions and adjustments akin to the well-known predator-prey model.

Oh! the predator-prey model, I know that one: Foxes and Rabbits... Foxes eat rabbits, so the rabbit population declines... Rabbits grow scarce, so the fox population declines... With fewer foxes hunting rabbits, the rabbit population increases... Then the hunting is good, so the fox population increases... and again, foxes eat rabbits, so the rabbit population declines. Even I know that one :)

Callahan's blog is great, so I figured I'd give the SSRN paper a shot. Here's the first paragraph:
This paper sets out to describe and begin modeling what we argue is a related group of theories of social cycles, all built on the framework of two populations, each of which disrupts the other, and adjusts to those disruptions, leading to the emergence of cyclical patterns in society. We find all of these theories akin to the well-known predator-prey model.

Okay, yeah, and I'm thinking of Hegel's dialectic. From Encarta 96: "The dialectical method involves the notion that movement, or process, or progress, is the result of the conflict of opposites."

Probably not relevant.

//

PDF page 3 of 30: "Gottfried Haberler (1946) sets out a detailed schemata of business-cycle theories attempting to place them into a family tree."

I'll have to look into that. The reference is
Haberler, G. 1946. Prosperity and Depression: A Theoretical Analysis of Cyclical Movements, 3rd. ed. New York.

//

From PDF pages 4-5:
In particular, what we mean by a true and endogenous social cycle is different from the fact that people will tend to flock to the beach in the summer, and the ski slopes in the winter, that they tend to use more artificial lighting in the evening than in the day, or that harvest festivals are in the fall while lamb is eaten in the spring. A social scientist may be curious as to why, say, people go to the beach or why there are harvest festivals at all, but given these things exist, it is pretty obvious why they happen when they do. While, as we will see in our subsequent schema, these are true cycles, the generation of the cyclicality is clearly exogenous to the social world. We may march through the same typical sequences of events repeatedly, but the fault is in our stars, or our solar system, or the Big Bang, or God. But the basic cyclicality is not a social product, and the social component consists in the chosen response to a cycle beyond human control.

What is of particular interest to the social scientist are cycles that arise endogenously in the social world. And not just that: are there purely social cycles that occur without being intended by anyone? So, if a village holds a maypole dance, there is not much of a puzzle as to why the dancers keep winding up in the same places: that is what they intended to do. But if an economy repeatedly arrives at a high level of unemployment, or a political regime keeps cycling through periods of order and of chaos, then those events are far more curious. Presumably, no one has arranged to have periodic business downturns or regular episodes of violent disorder, but there they are.

There they are.

I knew it would be good.

Monday, February 9, 2015

like the grave of a zombie.


Krugman:

The problem with private debt is that we have good reason to believe that in very wide-open financial systems people get irrationally exuberant, lending and borrowing to an extent that they eventually realize was excessive — and that there are huge negative externalities when everyone tries to deleverage at once.

So people get irrationally exuberant, huh? It has nothing to do with incomes failing to keep up with costs, nothing like that?

More to the point, has it nothing to do with policies that lead to increased use of credit, and the complete absence of policies which, by accelerating the repayment of debt, could prevent the increased use of credit from creating an accumulation of debt that sooner or later becomes unsustainable?

No? It's only the foolishness of over-exuberance?

Professor Krugman, your explanation is shallow and empty,

Sunday, February 8, 2015

After this morning's drubbing of Milton Friedman...


The Franklin M. Fisher PDF is so old that my browser's search command can't find anything in it. I can't find the Syll quote that way. So I thought I'd read the thing and look for it.

Here's what I'm finding. From page 3:

The central question which concerned Keynes in the General Theory was that of how there could be a stable equilibrium with less than full employment.

The PDF is so old that when you copy-and-paste, each word comes out on a line of its own and you have to fix all that.

The PDF is so old that it underlines book titles. These days, on the internet, underlining is for links, and book titles are generally put in italics.

The quote Syll used is from page 4. But nothing about Milton Friedman there.

The pages are numbered; the page with page number 4 is PDF page 7 of 54.

The PDF is dated 1975 and appears to have been done on a typewriter. Remember typewriters?

"wasting our time"


This is one of those times I have to put something on the blog to improve my chances of being able to find it again later.

Here it is: In Finding equilibrium, Lars P. Syll quotes Franklin M. Fisher:
An extremely prominent economist [Milton Friedman – LPS] long ago remarked to me in passing that the study of stability is unimportant because it is obvious that the economy is stable and, if it isn’t, we are all wasting our time.
Come to think of it, Friedman was dissing Maynard Keynes. For in Chapter 2 of his General Theory Keynes wrote:
Most treatises on the theory of value and production are primarily concerned with the distribution of a given volume of employed resources between different uses...

... But the pure theory of what determines the actual employment of the available resources has seldom been examined in great detail... I mean, not that the topic has been overlooked, but that the fundamental theory underlying it has been deemed so simple and obvious that it has received, at the most, a bare mention.

"This book," Keynes says in his preface, "has evolved into what is primarily a study of the forces which determine changes in the scale of output and employment as a whole..."

Keynes, then, described his book as an attempt to understand the forces determining growth and the lack of growth -- to understand, in a word, instability.

Milton Friedman then described the work of Keynes as a waste of time.

Saturday, February 7, 2015

New puppy


All else falls by the wayside.

"Lexi"

Rottweiler and Shepherd. We got her Thursday.

The bigger paw (lower right) is Mish.

Friday, February 6, 2015

The politics of what if


Part of a quote from Wolfgang Streeck, in Syll's The politics of public debt:
What if a resumption of growth, as implied by older traditions of political economy, requires more public investment rather than less, and perhaps also a reversal of the apparently inexorable trend toward ever more inequality?

What if it doesn't? What if it doesn't require more public investment rather than less. What about that? Nobody ever thinks to look for some other solution, other than increasing government spending, or decreasing government spending.

Everybody is still fighting the last war, the war on the Great Depression.

Thursday, February 5, 2015

"The decrease in price does him no good, because the decrease in his income is greater."


Recommended reading: greg's Destruction of Production from Unbalanced Trade at Another Amateur Economist.

Wednesday, February 4, 2015

A pretty pebble


The grandchildren came to visit for the Christmas holiday. At dinner Sam, the three-year-old, remembered putting eggs in cups "a long time ago". His grandmother deciphered "putting eggs in cups" as "coloring Easter eggs" and said yes, we'll be doing that again in just a few months.

Sam has yet to learn of yearly events.

A couple times during his visit, Sam said he wanted to go in the pool. It's too cold, he was told. He'd have to wait until Summer.

He has yet to learn of the yearly cycle of seasons.

He gets a few years older, he'll learn these things by experience.

Me, I've seen enough business cycles to think that when car companies are hawking interest rates below 2% in TV ads, the recession is over. But it took half my life to figure that out, and we're talking cycles of ten years or less.

Who will recognize 50-year, 80-year, 100-year cycles? Everyone will have doubts.

Who will recognize the 2000-year Cycle of Civilization? You won't see it if you expect to find it the way we find annual cycles and business cycles.

Instead, carry the C of C like a pretty pebble in your pocket that you want to pull out sometimes to look at. See if the world makes more sense when you think of things in the context of a cycle of civilization.

Tuesday, February 3, 2015

Debt Forgiveness in Croatia


From the Washington Post: Croatia just canceled the debts of its poorest citizens
Starting Monday, thousands of Croatia's poorest citizens will benefit from an unusual gift: They will have their debts wiped out. Named "fresh start," the government scheme aims to help some of the 317,000 Croatians whose bank accounts have been blocked due to their debts.

Fresh Start is expected to affect about 60,000 of the 317,000 with blocked bank accounts, out of Croatia's population of 4.4 million people.

... the number of indebted citizens is significant and has become a major economic burden for the country. After six years of recession, growth predictions for Croatia's economy remain low for this year.

Yeah.

Among economists, the scheme is regarded as unprecedented and exceptional. "I can't think of anything comparable," Dean Baker, co-director of the Washington-based Center for Economic and Policy Research, told The Washington Post.

Some economists, among them Baker, are skeptical whether the scheme will succeed: "I am not sure that this is the best way to help low-income people..."

Yeah, no. Don't think of it that way. Don't think of debt forgiveness as a way to help low-income people. Think of debt forgiveness as a way to restore vigor to the economy. Debt forgiveness helps everybody.

Evidently, Dean Baker does not see excessive accumulation of debt as the cause of economic lethargy. If he did, he would call for more debt forgiveness, not less.

This is always my focus: to convince people that excessive debt slows the economy, that this is our problem today, and that it has been the problem -- in the U.S. at least -- since the 1960s.

Monday, February 2, 2015

There and Back Again


From Domesday, by Michael Wood:
In the mid-third century, after a series of economic crises, the currency of the Roman Empire became worthless and the government was forced to raise most of its revenues by requisitions in kind, and to pay the army mainly in kind, with foodstuffs and supplies. Then from the 270s onwards came what the late Romans called the renovatio, the renewal, under the Emperor Diocletian. It was Diocletian who reorganized things into an elaborate system of taxation in kind.
 
From The Wealth of Nations, by Adam Smith:
The revenues of the ancient Saxon kings of England are said to have been paid, not in money but in kind, that is, in victuals and provisions of all sorts. William the Conqueror introduced the custom of paying them in money...

Sunday, February 1, 2015

He's not sure which, but it doesn't matter


In Technology and the unbundling of commercial banks, Winterspeak describes the evolution of finance and lists several new, high-tech lending companies. He offers this summary:
The primary purpose of commercial banks, the function that makes them banks, is making credit evaluations. Any company which takes on that function without the accompanying risk if the loan is not paid off, is in a moral hazard situation which will ultimately create a credit bubble. I'm not sure which of these does that, but worth keeping an eye on.

"I'm not sure which," Winterspeak says.

No matter which. They all create debt, so they all contribute to rising financial cost. They all increase costs for the producing and consuming sectors. At any given interest rate, the cost of finance varies with the level of debt accumulation: the more debt, the higher the cost.

It should be obvious that as the cost of finance increases, the break-even point for new borrowing also increases. It takes little borrowing to equal the financial cost of a small debt. But it takes a lot of borrowing to equal the cost of a massive debt. The break-even point is how much we have to pay to service existing debt. When new borrowing is less than the break-even point, the boost from borrowing is less than the drag from existing debt. Only above the break-even point does new borrowing boost economic growth.

When debt is large, high levels of new borrowing are required just to reach the break-even point. But high levels of new borrowing make a big debt bigger, faster, and push the break-even point even higher. This is a scenario that cannot end well.

The problem is not borrowing, really. The problem is that we let borrowing accumulate as debt. The only policy we have that ever slows the growth of debt is raising interest rates to fight inflation. But raising interest rates increases the cost of finance and pushes the break-even point up more. This cannot end well.

An alternative would be to implement a tax that varies with taxpayer indebtedness. The tax rate could vary with the taxpayer's debt-to-income ratio, for example. In a booming economy the tax could be punitive, if Congress really wanted to do that; for a troubled economy it can be designed to help people reduce their debt, providing tax credits for accelerated debt repayment. Either way, it would be using fiscal policy to do something that until now has only ever been monetary policy.

The Accelerated Repayment Tax would work like raising interest rates, but only for people excessively in debt. For everyone else, it would be like leaving interest rates low. This is a two-pronged policy that can encourage growth and fight inflation at the same time. It brings far more finesse to policy than you get from jacking up rates.

The particular meaning of "excessively in debt" would be determined by the wisdom of Congress. The chosen "max debt" level would soon become a standard among taxpayers, and a standard for society. Congress will surely want to choose a level that provides maximum economic vigor.