Showing posts with label Long and variable. Show all posts

Monday, November 10, 2014

Money Relative to GDP: Rates of Growth


Graph #1:Percent Change in "Money Relative to GDP" 1916-1970

Graph #2: Percent Change in "Money Relative to GDP" 1970-2014
Click either graph for source page -- Google Sheets for Graph #1, FRED for #2.

On both graphs, base money shown in gold, M2 money in red. Graph #1 shows M1 money (blue) while #2 shows MZM (green).

On both graphs, the different money measures all move together. The money measures all move in the same direction and change at the same time. This generalization appears to be somewhat less true of the second graph than the first. But even on the second graph it is for the most part correct. There are no lags between base money and the other moneys as there are between base money and inflation. Evidently, there are lags between all the moneys, and inflation.

What does this mean?

It means that the metabolism of the economy -- the source of lag -- does not depend on the quantity of money. Or at least, it doesn't always depend on the quantity of money.

This is premature, but I'm tempted to say it depends on the willingness to spend.

Saturday, October 11, 2014

The Ridges on the Rocks


Maybe you need an accordion axis. Or maybe the lag amounts mean something.

There is a story I like very much, told by Lionel Ruby in "How the Scientist Thinks":
Darwin and a fellow scientist were searching for fossils in the north of England. They were not aware of the glacial theory at the time. Years later Darwin revisited the area, and he was now astonished to discover how clearly marked were the glacial ridges on the rocks. He had not noticed them on his earlier visit because he was not looking for them.... Darwin was able to appreciate the glacial markings only after he became aware of the glacial theory.


Sure: If the glacial theory was wrong, knowing about it and looking for it would still have led some people to see it in the rocks. But that's the trade-off, isn't it. If the glacial theory is right, and you don't know about it, you may not see it even if it is clearly marked in the rocks. Even if you are Darwin.

Me? I'm just lookin at the economy.


From the interactive experiment I captured some images with different lag values. On each image I highlighted in yellow the the part where I think the two graphs match. Some are obvious. Some may be a stretch. It's all by eye anyway; this is conceptual economics. But hey, it can't be any worse than the stuff that passes for "mainstream".

Slide your mouse back and forth across the Animation Bar below the graph:

Lagged Effects of Base Money: an Animation

Zero Year  Lag Two Year  Lag Four Year  Lag Five Year  Lag Seven Year  Lag Six
Year  Lag 
Five Year  Lag 

Now I want to show you the ridges in the rocks. I want to show you what I see.

First, notice that the red line does not move when you drag the mouse across the Animation Bar. The red line is the same in every frame because inflation is a resultant and because the history of inflation is what it is. As your eyes pass over the red line from left to right, you are simulating the passage of time.

Second, notice that the yellow highlight moves from left to right as you drag your mouse from left to right across the Animation Bar. The yellow highlight directs your focus to "similarities" between the red and black plot lines on the graph. The similarities are highlighted left to right because I tend to read graphs from left to right, again simulating the passage of time.

To my mind, the similarities offer a way to measure lag: Slide the Base Money graph over the Inflation graph until you find similarity. Then observe the distance you moved the graph. On our horizontal axis, that distance is a measure of time. It is the time it takes for the pattern of the one graph to show up on the other. We are measuring lag.

Third, notice that the black plot line, the Base Money plot, moves as you drag your mouse from left to right across the Animation Bar. At each step, the black line is offset a number of years from chronological time; this offset is the lag.

Granted it's all done by eye, and the annual steps are large and ungainly. Still, we are only attempting to observe similarities between two data sets -- and this is no more than common practice. What's odd is that the similarities show themselves separated by "large and variable" lags.

In order to see the similarities we need to develop an "accordion axis". For if you observe the movement of the black line as you move the mouse across the Animation Bar, you will notice that the black line moves first from left to right and then from right to left. The "similarities" depend at the start on an increasing lag, and, by the end, on a decreasing lag.

I am arguing that an increasing lag is associated with a slowing economy and that a decreasing lag is associated with a recovering economy. I am preparing to argue that the size of the lag is proportional to the severity of the economic slowdown.

Thursday, October 9, 2014

An Interactive Inflation Experiment


If you're worried (or not) about inflation resulting from the Quantitative Easing of Base Money since the crisis, you might want to be looking at the rate of inflation:

Graph #1: The Rate of Inflation since 1913
and at the rate of Base Money growth:

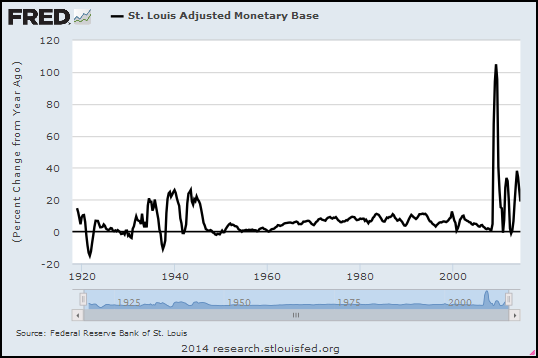
Graph #2: The Rate of Base Money Growth since 1918
The money numbers go back to 1918 -- the year my father was born, God rest his soul -- and the price numbers go back even farther, to 1913. The numbers for both are monthly (so there's a lot of data) but for today's graphs I'm using quarterly values and showing "percent change from year ago". Maybe that's more than you wanted to know. If not, you can click either of the above graphs to go to its FRED source page.

Graph #3: Rate of Inflation, 1918-1960, #MQp

Graph #4: Base Money Growth, 1918-1960, #MQo
I reduced the range of dates on both graphs so they start on 1 January 1918 and end on 1 July 1960. These dates center the Depression-era Quantitative Easing on Graph #4, and allow ten years or more before and after that QE, where cause or consequence might show up on the graph of inflation. Oh, and I erased the background and border of the Base Money graph to make it see-through. So now we can put the base-money graph on top of the Inflation graph and see the two plots together.

Plus, I figured out how to use buttons to move the one graph relative to the other.

You can use the buttons to look for patterns in inflation that match or don't match patterns in base money growth. The "zero year" button aligns the dates of the two graphs, 1930 atop 1930, 1940 atop 1940, and so on. The "1 year" button shows money growth lagged one year; the "2 year" button shows money growth lagged two years; and so on.

The "10 year" button aligns 1930 on the base money graph (black) with 1940 on the inflation (red) graph. You can check the x-axis dates to see what the buttons do.

Even before you click a button, notice that the two lines match pretty well in the early years (up to 1930). After that it's a jumble. So, click some buttons and look for pattern similarities, and have some fun with this thing.

bottom image
top image
Graph #5: Base Money Growth (black) Overlaid on the Inflation Rate (red)
Click a Button to Lag the Base Money Graph by the Number of Years Indicated.


NOTE: If the buttons don't work for you, try this post instead.

Here's what I see: When base money is lagged seven years, the three major increases in base money (1934-1946, black) align remarkably well with three inflationary peaks (1940-1953, red). With a seven year lag.

As I observed yesterday, it is now just six years since quantitative easing began, in September 2008.

During the Great Depression, it took seven years for the unusual pattern of base money growth to be echoed in the inflation pattern. It took seven years, in other words, for inflation to arise as a result of base money growth in the 1930s.

In this post I offer one conclusion: It is still too early to say no inflation will arise from the quantitative easing of our time.

Monday, March 10, 2014

The metabolism of the economy

From my development blog, dated 31 July 2013, apparently never posted.

Krugman recently had two in a row on inflation and the politics of economics. I'll try to ignore the latter.

#1
July 29, 2013, 4:57 pm

The She-Devil of Constitution Avenue

I’ve spent five years and more watching the inflationphobes, who weren’t particularly sensible to begin with, descend into shrill unholy madness. They could have reacted to the failure of their predictions — the continued absence of the runaway inflation they insisted was just around the corner — by stepping back and reconsidering both their model and their recommendations. But no...

I’ve been saying for a long time that we aren’t having a rational argument over economic policy, that the inflationista position is driven by politics and psychology rather than anything the other side would recognize as analysis.

#2
July 30, 2013, 8:52am

Triumph of the Doves

When we first entered this crisis, economists and economic pundits quickly sorted themselves out into two camps. One camp — the “doves” — basically said, we’ve turned into Japan; we’re a liquidity-trap economy in which even large deficits won’t drive up interest rates and even huge expansion of the Fed balance sheet won’t cause inflation. The other camp said that we weren’t Japan, we were or soon would be Weimar, or maybe just the 1970s: high rates and high inflation were just around the corner.

These differing views reflected fundamental differences in economic models — differences that tended to be associated with political leanings, although there are a handful of politically conservative market monetarists out there.

And history has given us as decisive a test of rival economic theories as I’ve ever seen.

In the first couple of years, as the data kept coming in favoring the liquidity-trap view, I kept hearing accusations that those of us citing these data were “cherry-picking”, that the evidence was actually running the other way. I don’t hear that so much now — it’s just too obvious that the promised inflation and rate surge never materialized.

For me, the squabbling over who-is-right in economics isn't economics. It's politics. And it is the least interesting thing. I quoted those last few lines because of the last bit of it -- "the promised inflation and rate surge never materialized."

Sounds pretty final, doesn't it? "Never" is a long time. It might be too early yet to make that judgment call.

I did a post the other day...
By the way, in mine of 4 June I related the Depression-era increase of the monetary base to inflation. I made reference to "three massive spikes" of inflation in that era. You can see those three spikes, in red, on the graph below. Each spike occurs approximately eight years after the corresponding spike in the monetary base:


Graph #3: The Rate of Money Growth (blue) and the Rate of Inflation (red) 1925-1970

Eight years is a long time, certainly longer than I would have thought. But the economy was unresponsive in that era, and this could account for the eight-year delay.

There is a fourth blue spike on the graph, just a hump really, between 1950 and 1955. Perhaps it is related to the Korean War? Anyway, about five years later there is a red hump of roughly equal size. This time there is only about a five-year delay between the monetary inflation and the price inflation.

Why five years instead of eight? Perhaps because the economy was more responsive... because the economy was growing again.

Finally, beginning around 1960 there is another increase in the blue, the monetary base. And sure enough five years later there is an increase, a comparable increase in the red, in the rate of inflation.

I never looked at this before. The relation is remarkable. I suppose I should point out that the relation seems to break down by 1970.

But you know, I don't think the relation breaks down by 1970. I think time is relative, and the eight-year delay which turned to a five-year delay which turned into a much shorter delay is all part of some pattern that has to do with the "rat-race" or the metabolism of the economy or something like that.

During the Great Depression there was a huge lag. Some time later, the lag was only half as long. Later yet, the lag was practically gone. That's why Milton Friedman was evasive about lag time. He couldn't pin it down.