Monday, January 31, 2011

Slept on it


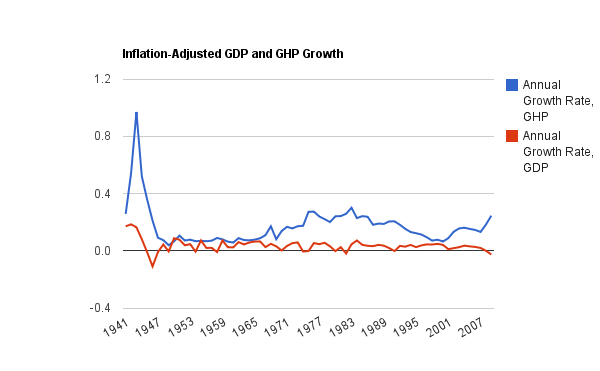
I corrected for inflation too soon. That has to be it. That's the only change I made to the numbers. All the other stuff was just getting the numbers, or showing them.

Couple days back I looked at Gross Federal Debt as a Percent of GDP. Looked for a trend. Found one.
Or invented one. Whatever.
Looked at that trend, long-term. And wanted to find the economic growth that would have kept the federal debt number going down, kept it following the trend.

It's backwards from what everybody else does. Everybody else looks at Federal Debt Relative to GDP and says the federal debt is too high.

But the original complaint, remember, was that economic growth was too slow: GDP was not increasing fast enough. So to me, backward is the right way to go. Rather than focusing on squishing down the federal debt, I want to consider the growth we would have needed, to make the federal debt seem size-reasonable. Then I want to look at that growth and see if it is realistic.

Anyway, I'll make a new spreadsheet. And this time I'll correct for inflation later.


I'll keep the original sheet called TABLE, which has the source numbers untouched.

I'll keep my Sheet1, where I develop the numbers for the exponential trend.

And I'll keep my Sheet2, where I develop the Gross Hypothetical Product. But I'll delete from that sheet the GDP Deflator and the inflation-adjusted GHP. And I'll delete Sheet3 and Sheet4, where I used the inflation-adjusted numbers and my graphs went astray.

On Sheet2 I'm adding the column "Gross Federal Debt as a percent of GHP." That's redundant, because it'll give me the exponential trend numbers again. But at least I can do a graph, and I have numbers to use for GHP.

Let's compare GHP to GDP. No inflation-adjustment. The GDP numbers -- actual, or "nominal" this time -- again come from Measuringworth.


Wow. These numbers are big. The GHP makes the GDP look small. It doesn't look like "realistic" growth. What this means I guess is that debt really took off. And you can see some kinks in the red line, where it suddenly starts going up faster than it did before. That's driven entirely by the growth of federal debt.
That's not something you'd normally hear me say. But I have to say what the graph says. Still, it's much too early to draw any conclusions.
Let's cut off some of that right end of the graph, and look at it where the lines are closer. I'll stop this time at 1982:


There is a definite break with the trend. A closer close-up shows the break occurring between 1974 and 1975 or -- more accurately -- shows the change in 1975 and after:


"That is enough for today!"

Sunday, January 30, 2011

Notable


Please note that I am not against the idea of cutting the size of government. Far from it. My objection is that it will not solve the economic problem.

Quotable


"Please note that I am not against people helping each other and being charitable. Far from it. My objection is that it will not work..." -- Bill Mitchell

Saturday, January 29, 2011

I respect PK for this

...And it is going nowhere.


GRAPH #1 FROM YESTERDAY'S POST
As a follow-up to Dunno where this is goin' yet..., I want to take Federal Debt as a "given."

Given that we have the federal debt we have, what would GDP growth have to look like, to make the blue line keep going downhill like the red line?

I can use the federal debt and the exponential trend to calculate the GDP growth that would have been required to keep the blue line on the same path as the red line. And then I will look at this hypothetical GDP growth and see what there is to say about it.


Done. The "Hypothetical GDP" numbers are calculated in Sheet 2 of my Google Docs spreadsheet.

What to say about it? So far, my only impression is that the numbers get big. But I always get that same impression from looking at actual GDP numbers. So...

I want to take this hypothetical GDP and take inflation out of it. I can use the GDP deflator I guess; I have nothing else.

This assumes that nothing else changes. That's kinda silly: Nothing changes, except the GDP is way bigger. But again, I have no other way to remove the inflation. Anyway, this whole exercise was hypothetical from the start.

I can get "GDP Deflator" numbers from Measuringworth.


Ahh, but Measuringworth does not list the "TQ" there between 1976 and 1977. So now it is time to delete the "TQ" row from the Federal Debt and Hypothetical GDP columns.

I'm thinkin that might put a slight kink in my exponential curve. So be it.

Okay. Over in Column K on Sheet 2 I have Hypothetical "Real GDP". It is time to stop using the word "real" to mean "inflation-adjusted." If ever there was an example of why the word "real" is the wrong word to use, this is that example.

Also, it is too much typing to call it "Hypothetical GDP" every time. I'm gonna change this from "Hypothetical Gross Domestic Product" to "Gross Hypothetical Product" or GHP.

I will copy over these inflation-adjusted Hypothetical GDP numbers to a new worksheet, where I will label the column Inflation-adjusted GHP.


Sheet 3 shows the inflation-adjusted hypothetical output numbers. Still not sure where this is going. I want to look at the annual growth rate of this hypothetical, inflation-adjusted GDP. I think I want to compare it to the old "potential GDP" numbers. But I don't know what the result will be.

I want to point out that I'm writing this post as I develop the spreadsheet numbers. I do expect that GHP, hypothetical output, will not be outlandish. Because everything I know about the economy from other graphs I've done leads me to expect such an outcome. But I don't know that, yet.

So let's look at a graph of the annual growth rate of GHP.


Wow, these numbers are up there! Ignoring the WWII spike, there's a big lump in there reaching 25% annual growth, around the dates 1977 and 1983. Even where it's low, 1953-1959-1965, the spreadsheet numbers are in the range of 6 or 7 or 8% annual growth of GDP. That's more than I expected.

You can also see on this graph a downtrend from 1983 to 2001, the Reagan-Bush-Clinton years when the federal budget worked its way toward balance.

This graph shows how much GDP would have had to grow, to keep the federal debt a declining percentage of GDP. The calculation is based on the years 1955-1973, when the federal debt was in fact a declining percentage of GDP. On this graph, 1955-1973 includes the low years, but also includes the rise toward that 25% level.

The spreadsheet numbers for 1973 and 1974 are a bit over 17%, meaning a 17% growth rate. Which is ridiculous. Even China doesn't grow that fast.

But what I'm thinkin though, is that this graph should show realistic growth rates for the 1955-1973 period, because that's where the exponential curve matches the federal debt numbers. If you remember, the actual numbers varied back and forth across Excel's calculated trend. So on this graph, in that 1955-1973 range, the growth rates should be very close to actual, inflation-adjusted GDP growth rates. They're not.


Oh, they're closer in the 1950s and '60s than in the '70s and '80s. But that's not what has to happen. The simulated GDP, the GHP, for the years 1955-1973 should be almost identical to the actual GDP for that period. It should be as close as the exponential curve is to the federal debt numbers for those years.

"Given" that we have the federal debt we have, what would GDP growth have to look like, to make the blue line on graph #1 keep going downhill like the red line? For the years 1955-1973 there should be essentially no change at all. The red and blue lines should be almost identical. They're not.


They don't overlap at all, really, except the first year, 1955.

I think there's something wrong with my numbers.

I have to think about this some more.

I'm open to suggestions.

Friday, January 28, 2011

Dunno where this is goin' yet...


GRAPH #1: GROSS FEDERAL DEBT AS A PERCENT OF GDP and EXPONENTIAL DECLINE

The mind goes where it will. So I Googled federal debt relative to GDP. Supporting Evidence had a nice graph. I clicked the link below their graph,

Budget of the U.S. Government, FY2011 Historical Tables, Table 7.1-Federal Debt At The End Of Year: 1940-2015
and found myself looking at numbers. So, I did what comes natural: I made a graph and started looking for trends.

The curve from the high point around 1946 to the bottom around 1981 looked like a trend to me. Before 1946 was World War II, which is an outlier, certainly. And since the early 1980s we had Reaganomics, which was an attempt to fix the economic problems of the 1970s. So I wanted to focus on the trend of the 1946-1981 period. Also, I wanted to use an exponential curve for the trend, because exponential curves are associated with growth and decay of societies and such.

I let Excel figure the trend line for me. I don't know any other way, any easier way to get the y=cebx formula noted in the Excel Help.

I cropped the data to 1946-1981 and had Excel overlay an exponential curve on it. Pretty close, but the actual numbers are all higher at the beginning and higher at the end, and all lower in the middle.
So I chopped off the last few years. I decided to end the graph at 1973 because that's the end of the "golden age" of economic growth. So anything after 1973 would probably be a different trend anyway. Now the exponential is a good match except in the early years. You can see that the R-squared value increased to 0.9743 in this graph, from 0.9412 in the previous one. The closer this value is to 1.0, the better the "fit" between the exponential trend and the actual numbers.

So I shortened the graph some more, to remove the mismatch of the early years. Now the graph starts in 1955, after the Korean War. And the exponential is a good match to the actual numbers. The two lines cross each other repeatedly, as though the exponential is centered on the actuals. Also, the R-squared value increased to 0.9854.

Now I was happy. Now I had a formula that fit the numbers.

y = 70.108e-0.0369x

I took this formula from Excel and put it into my Google Docs spreadsheet, extending the exponential curve for the full 1940-2009 period:

GRAPH #1 (REPEATED)

One glitch, one break in the exponential curve: The red line is interrupted between 1976 and 1977 where there was a change in the way the numbers are figured. I don't recall what the change was, but I've run across it before. (In the source data, in the YEAR column there is "TQ" which stands for "Third Quarter." The interruption in the graph occurs at that point.)

The red and blue lines of graph #1 shows a definite similarity in the 1955-1973 period, and a definite difference beginning in 1974. One could say there is a second trend that runs from 1974 to 1981, where a third trend seems to begin...

Thursday, January 27, 2011

Out of Context, I Know.


The Krugman writes:

But short-term interest rates are set by Fed policy; right now they’re more or less zero, but they will rise eventually — and hopefully sometime within the next 10 years — when the economy recovers sufficiently.

See, I wouldn't do that. I would keep interest rates near zero forever. Rather than raising interest rates -- which chokes off growth and raises cost in the whole economy, I would establish a variable tax rate. Someone with a lot of debt would pay higher taxes than someone with only a little debt. So only specific borrowers are targeted.

That probably doesn't sound good now, because now everybody has a lot of debt. But if that policy had been put in place before we had a lot of debt, it would have kept debt from accumulating. And that would have prevented the financial crisis.

Anyway, here's how it works: If you have a lot of debt you taxes are high. But you can lower your taxes by making extra payments on your debt. So it's not really as bad as it sounds. The goal of this plan is not to prevent people from borrowing. The goal is to get people to pay off debt, instead of rolling it over forever.

Oh -- paying off debt is a way to fight inflation. It destroys the money that borrowing creates. I think it would be way better to do that, than what we do now.

Wednesday, January 26, 2011

It's Good to be Consistent...

...but not when you're wrong.


John B. Taylor recently spoke at the American Economic Association luncheon. "I spoke about monetary and fiscal policy," he writes.

I presented evidence of an amazing six decade long correlation between rules-based policies and good economic performance. The correlation—along with basic economic reasoning—is strong evidence that rules-based monetary and fiscal policies are enormously beneficial to the economy.

That's about what you'd expect from the inventor of the Taylor Rule.


Watching Star Trek, the holodeck made me laugh sometimes. They would use it when they couldn't figure something out. They'd just run a simulation, and the results would tell them everything they needed to know. All well and good, for a TV tale. But in the real world, the quality of the results you get depends on the quality of your computer program and the data you start with. Garbage in, garbage out.

If you don't know all the relevant information to begin with, you cannot put that information into your holodeck program. You cannot put it into your economic-policy rules. Neither the rules of a simulator nor rules of economic policy can provide guidance when basic principles are unknown or overlooked. Garbage in, garbage out.

I let it go on Star Trek, because it advanced the plot and it wasn't real. But I won't let it go when somebody wants to do that to the economy.


The "Taylor Rule" encapsulates economic growth and inflation into a formula, so that when you do the calculation the Rule tells you what the interest rate should be. To me, that's like getting an answer from the holodeck.

The Rule takes the difference between actual and potential output, and the difference between actual and desired inflation, and the real interest rate, and the inflation rate. And from these numbers it calculates a "target interest rate" for the Federal Reserve to use. And this is said to give us the best of all possible worlds.

The Taylor Rule evaluates the primary concerns of policy -- growth and price stability -- in an objective and "scientific" way. The rule looks at things the economists who use it think are important. But it doesn't look at everything.

For example, the Rule does not look at the level of debt in the economy. So there is no way the rule could have predicted the the financial crisis of 2008.

After the fact, Krugman and others have used the rule to show that the target interest rate is now well below zero. That result tells Paul Krugman that there is a problem. But "after the fact" is not prediction.

The Taylor Rule has been telling us for years what the "right" interest rate is, for the Fed to set as policy. And (according to the graph Krugman shows) the Fed pretty much followed the Rule. But we had the crisis anyway, and we had the worst recession since whatever. The Rule didn't predict it. Garbage in, garbage out.


"The Rule didn't predict it," says I. Here's what Econbrowser has for 28 July 2008:

As Europe teeters on the edge of recession, and the United States remains mired in slow growth, expectations of what interest rates, and hence exchange rates, are shifting. Here's a familiar depiction of where policy rates in the US and the euro area have been, and where they are predicted to go.

As long the euro area rate is projected to be above, and rising relative to, the US interest rate, the euro should remain strong against the dollar. These expectations are popularly thought to be a function of output and inflation gaps. This suggests that output and inflation gaps usefully be thought of as fundamentals for exchange rates. In other words, Taylor rule fundamentals can be used as empirical determinants of exchange rates.
"Taylor rule fundamentals," indeed.

The graph predicts the U.S. number to remain stable at the 2% level for a year or more. Here's what happened:


About two minutes after the Econbrowser article was posted, the rate fell to zero.


It does make sense to me, up to a point, to be consistent and use rules for things. For the economy and things. More than most people, perhaps. But as Captain Barbossa said, "the code is more what you'd call "guidelines" than actual rules."

Not sure how to end this post, so I'm just gonna quote a couple things I said before.

From Christina at '50:

The Taylor rule produces a number that economists think should be the right number, based on their incomplete and flawed understanding of the economy. Confidence in the Taylor rule presupposes that the modern understanding of economic forces is accurate and complete.

And from I think they miss something...:

Or if the Federal Reserve overlooks the significance of the reliance on credit, it might drive reliance to too high a level on purpose, without understanding the trouble that would arise as a result of this change.

And if they combined this naivete with

1. the mistaken notion that "too much money" can cause inflation but "too much credit-use" cannot; and
2. incomplete, open-ended rules based on a flawed understanding of the economy,

there is every chance that even a carefully-engineered, Taylor-made interest rate would lead us straight to financial disaster.
Rules are made to be broken.

Tuesday, January 25, 2011

Recovery is Not Enough


In Being Paul Krugman I quoted PK saying that the "sensible" thing would be to "run deficits while the economy is depressed, then turn to budget-balancing once recovery is well in place."

For that to be anything but nonsense, we would have to expect a recovery substantial enough to permit budget-balancing to be realistically possible. We don't get recoveries like that anymore.

We get recovery, but we need economic restoration.

When we get "recovery," the recession ends. The growth we get is the growth we get. But the growth we get has been unacceptable since 1974. That's what killed Keynesian economics and gave birth to Reaganomics. And Reaganomics helped. But it was based on unsustainable strategies, like a continuously-increasing concentration of income and the continuous expansion of public and private debt.

Recovery is no longer sufficient. We need an economic restoration.


Recently I spoke of a comment by Pluto Finnigan:

Before the crisis, Pluto observes, employment was sustained by "an unsustainable credit expansion." He suggests that the present high unemployment may be the best we can expect, in a world where credit expands at a sustainable rate. The issue Pluto raises is credit-efficiency.

Credit-use boosts the economy but adds to accumulated debt, which is a drag on the economy. The longer we continue to rely on credit for growth, the bigger the drag, and the less efficient is credit-use as a way to boost growth. After a while, to counteract the drag you need an "unsustainable" credit expansion.

Our economy ran into problems with accumulated debt in the 1970s. Since then our policies have put more and more emphasis on improving growth. But our pro-growth policies are still built on the notion that we need credit for growth. Those policies only increase the accumulation of debt. That is why growth remains inadequate.

Recovery is not enough. We need economic restoration. We can achieve restoration by wiping out half our accumulated debt, more or less. But a focus on public debt will achieve nothing. The big accumulation of debt is in the private sector.

Monday, January 24, 2011

The Major Barrier to Job Creation: Wages

"Stymie" is a weird word.

Excerpts from The State Column post of 18 January 2011:
...President Obama will announce a government-wide review of federal regulations, aiming to eliminate rules that stymie economic growth.

In an article published in the opinion pages of The Wall Street Journal, Mr. Obama says he plans to sign an executive order aimed at making “sure we avoid excessive, inconsistent and redundant regulation.” Mr. Obama says he hopes to eliminate regulations stifling job creation.

Business leaders have complained publicly about burdensome regulations, claiming they are a barrier to job creation.

Nothing new here. None of the rules are changing. Regulations may change, but that's not the same thing at all.

Business leaders have complained publicly about burdensome regulations, claiming they are a barrier to job creation.

Regulations are not the only thing that's "burdensome." For business, wages are a burden, too. And taxes. And even the prices charged by other businesses are a burden. What's unstated here is the view that regulations are optional.

That is not an assumption that should be made with confidence.

Sunday, January 23, 2011

Debt Accumulation


Let's say we have a $100 economy. GDP is $100 in "year one."

Or GDP could be 100 percent, or 100 conceptual units of output or 100 "apples and oranges" or 100 "atoms and sweat." Whatever's the easiest way for you to think about it. For me, it's dollars.

So we have GDP at 100. And let's say we have no debt at all, to start with. Zero debt.

That's probably not realistic, for a developed economy. Call it a simplification.

I want to look at the effect of credit-use in this little economy. Let's say we borrow an amount equal to 6% of GDP each year. I don't know how that compares to the real world, but just say.

And say we pay back, on average, 4% of our outstanding debt each year.

And one more thing. Say our credit efficiency is 80%. In other words, every dollar of new credit-use boosts GDP by 80 cents. That's pretty high, I think.

I'm not saying any of these numbers are realistic. But they do produce interesting results in a spreadsheet:


1. Even though debt starts at zero, it rises rapidly and soon is greater than GDP.

2. As the accumulation of debt grows in size, the increase in GDP gradually falls off. GDP reaches a peak and starts to decline as the drag from debt repayment grows relative to the boost from credit use.

3. This outcome is purely mathematical. The decline of GDP is the consequence of simple arithmetic. There is no politics in it. There is no China in it. There is no peak oil in it. There is no regulation in it. The only operative factor is the accumulation of debt.


You can fiddle with the spreadsheet. I saved it as a Google Docs template, so if your fiddling messes it up, you can open a fresh copy. Click this link to bring up the Google Docs template preview. Click the "Use this template" button to open the spreadsheet.

If you can't access the spreadsheet: The Google Docs help says You need to be signed in to your Google Account in order to use a template. ...Or maybe the template got deleted again, and I'll have to find a different way to make it available.


I involved my son Jerry in testing the spreadsheet. He wrote back,

This is a neat idea. I'm trying to think if i could make a little web
app to do it...

That was at 10:30 in the morning. By 1:00 in the afternoon, he had it working and was into revisions already:

hmmm... there is something missing from the model, here: interest and
minimum payments. As it is, i think the best solution is to set debt
repayment to 0 - then GDP just grows for ever !

And making my spreadsheet into a template -- that was my daughter-in-law's idea. All in all, a big family day for me.

Here's the link to Jerry's version of our Debt Accumulation economic model.


Notes on the calculations:


I set the sheet up so you only have to change numbers in the top row.

In the top row of my spreadsheet are three numbers. In Column D, above the words "New Credit Use" is the value 6.00%. You can change this number. The number in cell D1 is used to figure the "credit-use" values in column D. For any row, the "new credit use" value is 6% of the GDP value in that row: 6%, or whatever percent is in cell D1.

Above the words "Debt Repayment", in cell E1 is the number 4.00%. You can change this number. The number in cell E1 is used to figure the "debt repayment" values in column E. For any row, the "debt repayment" number is 4% of the Accumulated Debt number in column C on that row: 4%, or whatever percent is in cell E1.

Don't get mixed up between the "Year" numbers in column A, and the row numbers of the spreadsheet which are to the left of the "Year" numbers.

The third number in row 1 of the spreadsheet is 80.00%, in cell F1. This is the credit efficiency number, used to figure the "GDP Boost" values. Each GDP Boost number is figured as 80% of the "new credit use" value, less the "debt repayment" value from that row. Again, 80% or whatever percent is in cell F1.

It takes a lot of words to put calculations into English. But the arithmetic is simple. And the arithmetic tells me that the accumulation of debt puts downward pressure on GDP. The graph shows it.

Saturday, January 22, 2011

Sounds like a weak argument


You do not need to inflation adjust real goods or services -- a chair is always a chair, a haircut is always a haircut. - Winterspeak

What is typically called "nominal" output is more correctly called "actual" output. What is typically called "real" output is more correctly called "inflation-adjusted" output.


In mine of 15 January I used or misused the words of Winterspeak to say we cannot measure real output. But the more I read over my post, the more I thought it sounded like a weak argument.

Next day I quoted Keynes to strengthen my argument. But I think it still sounds like a weak argument. So I want to kick it around some more.

I like Winter's distinction between "real" and "nominal." Real is atoms and sweat, he says. Nominal is numbers in a spreadsheet.

But you know what? There's more to the story. Economists refer to "real output" and "nominal output" and the words imply things that are simply not true. The words should not be used that way. It builds falsehood into economic theory.

Real output is stuff. As Winterspeak said.

"Nominal" output is the total value of all we produce in a year, valued at the prices we actually paid to buy it. Nominal output is as close as you can get to real output, if you are trying to put output into a spreadsheet. If you take this nominal output, this total value based on actual prices, and then you change that number to take inflation out of it... Well, then you are farther from reality, not closer to it. But they call that "real."

Winter says:

An inflation adjusted nominal term is not "real", because it is still a number in a spreadsheet. It is worth inflation adjust[ing] nominal values so you can account for inflation and compare nominal values meaningfully across time. Nevertheless, inflation adjusting a nominal value does not give you a real value, it just gives you an inflation adjusted nominal value.

Agreed. And I really like Winter's idea to call such values "inflation-adjusted" rather than "real." But why is it important? Because of the way such numbers are used.


Again, Winterspeak:

At an economy wide level, if nominal incomes increase faster than real production, there is a risk of inflation

That statement translates into an equation that looks like this:

inflation is proportional to income over real output

In order to make use of this equation, one would have to translate chairs and haircuts and real output in general into "inflation-adjusted" output numbers. So let's introduce that translation into the equation:

inflation is proportional to income over inflation-adjusted output

We now have the word "inflation" twice in the equation, once on the left and once on the right. What is the significance of this?

If there is a stable or slowly-changing relation between income and output -- and there certainly is -- then introducing an inflation adjustment on the right side of the equation makes the right side proportional to the left. It makes the right side numbers look like the left side numbers when you graph the two sets of numbers.

In other words, you can use the calculation to simulate evidence of similarity between inflation and the ratio of your choice. For the record, this is just what Milton Friedman did in his Money Mischief graphs, except his equation was

inflation is proportional to money over inflation-adjusted output

The trick is that when you call it "output" or "real output" it sounds okay. But as soon as you call it "inflation-adjusted output" the bad arithmetic starts to stand out.

Friedman used that equation to create graphs that show inflation is proportional to "the quantity of money relative to output." But really, all the graphs show is that inflation is proportional to inflation.

Friday, January 21, 2011

Me and Them


THEMME


Options One and Two


I quoted Steve Keen yesterday:

Can we keep on borrowing our way to prosperity? Here’s where I turn cynic once more: we could, if we didn’t already have an unprecedented level of private debt

Absolutely: If we didn't already have all this debt, we could still use debt to grow the economy. But we do, so we can't. I see two possible solutions to this problem.

1. We reduce the accumulation of debt, so that we are again able to grow.

2. We find an alternative to using debt to grow the economy.

I'm in favor of both solutions. However, only the second is a long-term solution.

I like option one, because that stops the downward spiral. I see that as a necessary step. So I call for forgiveness, and printing money to pay off debt, and stuff like that. It's a quick way to reduce private-sector debt.

Massive global default would also work, but it would be disruptive. And it would be unfair to people who played by the existing rules. Some people seem to think it would be okay to do that. I think it is more important to change the rules.

Suppose we choose option one, and reduce the accumulation of debt. We reduce debt enough that the economy starts growing again, at a decent rate. We could do it in four years, if we use appropriate policy, or we could do it in four hundred, after another dark age. We can take matters into our own hands and fix things, or we can let the economy solve the problem at its own pace.

Say we do get the economy growing again. Some people will think the problem solved. But the problem isn't solved, because we didn't change the rules. If the economy is growing again, and we're using debt to grow, then debt is accumulating again. All we have to do is wait, and the problem will return.

Option two is a way to prevent the return of the problem. We prevent the return of the problem by limiting the accumulation of debt. We prevent the return by changing the rules to prevent the excessive accumulation of debt.

Now you may say that option two makes no sense, because we use debt for growth. And I would say, well yeah. I would say, take a step back and look at it again. Debt helps the economy grow, and then after a while it doesn't help anymore. This is the problem that must be dealt with.

But not in this post.

Thursday, January 20, 2011

The "Credit Impulse"


Selected paragraphs from Steve Keen, A Fork in the Road?:

Private debt has gone from rising by US$4.5 trillion in the USA—thus adding $4.5 trillion to aggregate demand—to falling by $2.5 trillion, and thus subtracting from aggregate demand there. This was the factor that drove the US from boom to near-Depression.

But though Australia began the deleveraging process, it stalled it just as the change in debt approached zero. The increase in debt since then has been a major factor in why our unemployment rate stopped increasing, and has since fallen.

The common factors driving the two economies (and therefore the difference in their economic outcomes to date) is starkly evident when one considers the “credit impulse”—or the rate of acceleration of debt.

[Australia] got out of the crisis before we really got into it by reversing the private sector’s trend to deleveraging, and encouraging borrowing once more.

Can we keep on borrowing our way to prosperity? Here’s where I turn cynic once more: we could, if we didn’t already have an unprecedented level of private debt

This implies a limit to the credit impulse (both in Australia and overseas). For the credit impulse to remain positive, then ultimately the debt to GDP ratio must start rising, and keep rising. But with the economy so heavily indebted already, the credit impulse is likely to peter out and give way to decelerating debt once more—with a negative impact upon aggregate demand.

This returns me to the bottom line of my credit-oriented analysis. Sustained recoveries from recessions in Australia and the whole OECD in the last 40 years have all been accompanied by rising levels of private debt to GDP. I simply don’t believe that’s possible now.

And Keen from a comment on that post, regarding the reliance on credit:

At an extreme, if you owe 1% of your annual disposable income and a loan shark is charging you 100% interest p.a., then you can get out of that trap in a few days: servicing the debt takes 1% of each paypacket, so increase the payment to 2% and after slightly more than 1% of the year is over, you’re out of debt.

If you owe 100% of your annual disposable income and an ultra-friendly building society is changing you 1% interest, it still takes 1% of each paypacket to service the debt. But it would take you more than a year to pay the debt down via the same manoeuvre.

This is, I'm quite certain, only the third Keen post I've ever read. Every time I do read one, I have to praise it. I agree more with Keen's analysis than with any other.

Given Keen's analysis of the problem presented here, I can only add that the obvious solution is to use policy to help reduce the accumulation of private-sector debt.

Wednesday, January 19, 2011

Great Minds Think Alike


From Steve Keen's Debtwatch, 16 December 2010:


From The New Arthurian Economics, 15 November 2010:


The nations are different and the timelines are different, but the focus is the same: the public and private components of total debt. And the conclusion is the same: private debt is the big problem.

Tuesday, January 18, 2011

Well that's odd

I love the personal touch in it


They want me to link to them, but they have questions for me first. That's odd. Sounds like a supply-side approach.

The Desire to Save


Take another look at at what Winterspeak said, from mine of the 15th:

The desire for the non-govt sector to save changes. It is the exogenous variable.

The "desire to save" changes. The most interesting thing about this is how often we hear about the desire to save, from MMT people who seem to treat it as sacrosanct.

Here's Bill, from the Billy Blog, from the 12th:

...the government can try to reduce its deficit by cutting net spending [but] if this runs, for example, against the desires of the private domestic sector to increase their saving ratio ... then the government’s aspirations will be thwarted.

And here's Tschäff, from a comment back in November:

We can say that given the savings desires of the world for dollars, there aren't enough dollars to satisfy that desire without causing people to cut back on their spending...

Three quotes, just off the top of my head. Tschäff sees savings desires as a given. Billy says the success of government deficit reduction depends on private-sector saving patterns. Winterspeak says saving desires are an "exogenous variable" -- they are a given, and they change.


The "desire to save" is not "exogenous." It is not a given. The desire to save is influenced by economic conditions and therefore is a consequence of economic policy.

As economic conditions worsen, the desire for economic security grows. Those who can afford to increase their saving, do. As for the rest of us, our "desire" to save increases as well, though our ability to save may not.

All right, so maybe making economic conditions worse isn't really one of the goals of policy. Conditions are still the consequence of policy. And that means policy is responsible for the growth of savings.


This graph is my look at savings. The trend line shows how much money we have in savings, compared to the money we have for spending. When the trend line goes up, savings is increasing faster than spending-money. When the line goes down, spending-money is increasing faster.

The graph shows savings growing faster from 1915 to the Great Depression... spending-money growing faster from the end of the Great Depression to the end of World War II... and savings growing faster after the war.

This graph is based on numbers from the 1975 "Bicentennial Edition" of the Historical Statistics. Somewhere among my Lost Papers, there is a hand-drawn version of this graph, from the late '70s or early '80s. Since that time I have understood that the uptrend leads to Depression, the downtrend accompanies recovery, and the uptrend accompanies growth -- but then leads again to economic troubles.
By 1977, when I took macro, the economy was already in trouble.
Our so-called "golden age" -- 1947 to 1973 -- occupies the post-war uptrend shown on the graph. But by the last years shown, you can see the uptrend tapering off just as it did during the Depression. We squeezed out only a few more good years before that golden age ended.

After that, economic growth wasn't so good anymore. That's when the Laffer Curve, the Two-Santa-Claus Theory, and supply-side economics, and Reaganomics arose, and lots of other trendlines started changing.


Among the changes intended to boost growth was the 401(k) savings plan created in 1978. In later years we find:


...among other policies and proposals designed to encourage saving. Every such policy that is put into place, of course, is good not only for savers but also for the economy itself, because it makes credit available for growth.
...or, it is generally thought to be good for the economy.
The MMT guys I quoted above would probably say the saving was not necessary, because banks can create loans without it. Doesn't matter. Policies were put in place. Saving was enhanced.

This graph is an update of the savings graph above. The blue trendline way down low shows the same data as the graph above. The red trendline is newer data.

There is a significant mismatch in the numbers, so the red and blue lines don't line up. But the red line definitely continues and extends the uptrend that began after World War II.

I made this graph an odd shape to give the old, blue line the same shape it has in the graph above. So you can see that saving increased a lot after the golden age ended in 1973.

Was all of this increase in savings -- an astonishing increase, really -- the result of policy encouraging people to save? Not likely. The increase was the result of direct policy actions like the 401(k) and indirect policy effects like the increased desire for economic security arising in response to a less-than-golden economic performance.


The point of all this is that the desire to save is not a "given." It is a response to policy and to economic conditions which are themselves a response to policy.

Mostly, a response to bad policy.

There is no reason to pretend that the desire to save is sacrosanct. I don't know why MMT people engage in such pretense.

Monday, January 17, 2011

Policies Beyond Measure

UPDATE: 18 JANUARY 2011

This one kind of got away from me.

I wanted to show similarities between Billy's view of NAIRU and my view of the "inflation equation" discussed in the past few posts. I ended up confusing his ideas with mine. I noticed this during the writing and should have responded to that red flag, but I didn't. My view of NAIRU, overall, is that I don't know enough about it to comment on it, really.

So take my comments on NAIRU here as Billy's thoughts and my interpretations of Billy's thoughts. I think that's not too far off.

This is an example of what happens when you (meaning, I) don't think about things enough on your own. When you pick up somebody else's idea and run with it. It's like building on a foundation of sponges. It's not good science.

For an example of my thoughts on NAIRU see The Cost that Crippled Growth

Below is the post that got away from me.


Billy Blog's recent When you know they don’t quite get it is in part an evaluation of the NAIRU in relation to policy, and its consequences for inflation and unemployment:

The NAIRU became a central plank in the front-line attack on the use of discretionary fiscal policy by governments. It was argued, erroneously, that ... full employment occurred when the unemployment rate was at the level where inflation was stable.

The estimated NAIRU (it is not observed) became the standard measure of full capacity utilisation. If the economy is running an unemployment equal to the estimated NAIRU then mainstream economists concluded that the economy is at full capacity.

They turned it around. The old standard for "full employment" was that everyone who wanted work could find work. But with NAIRU, full employment became the level of unemployment it takes to keep inflation stable, no matter how much unemployment that turns out to be.

In my recent post, Neil turned things around. As presented by Winterspeak, inflation was the result of income growing faster than "real output." But as Neil has it, inflation is evidence that income is growing faster than real output. In the one view, a cause of inflation is observed. In the other, the existence of inflation is taken as proof income is growing faster than output.

What Billy describes in his post -- what he rejects -- is that an unmeasurable factor, assumed to exist, is used to manipulate levels of inflation and unemployment. This made-up number is used to justify policy that pushes unemployment up.

What I rejected in my post is that an unmeasurable factor, known to exist, is used as part of a calculation that wants to draw a conclusion from the existence of inflation. This made-up number can be used to justify policy that pushes income down.

Neither the NAIRU nor real output can be measured. We "back into" the conclusion that the NAIRU is high, because it takes a high level of unemployment to stabilize inflation. We "back into" the conclusion that income is growing faster than output, because we observe inflation.

Sunday, January 16, 2011

...incommensurable collections of miscellaneous objects...


From yesterday, from Winterspeak:

An inflation adjusted nominal term is not "real", because it is still a number in a spreadsheet...

For today, from Maynard, from Chapter 4:
The National Dividend, as defined by Marshall and Professor Pigou, measures the volume of current output or real income and not the value of output or money-income...

But it is a grave objection to this definition for such a purpose that the community’s output of goods and services is a non-homogeneous complex which cannot be measured...

...incommensurable collections of miscellaneous objects cannot in themselves provide the material for a quantitative analysis...

To say that net output to-day is greater, but the price-level lower, than ten years ago or one year ago, is a proposition of a similar character to the statement that Queen Victoria was a better queen but not a happier woman than Queen Elizabeth — a proposition not without meaning and not without interest, but unsuitable as material for the differential calculus.

And again from yesterday's post:

I am pointing out that, as Winterspeak says, "real" output cannot be converted into numbers. So it cannot be used in a calculation to determine whether nominal income is increasing faster than real output.

Saturday, January 15, 2011

"...a lack of clearness..."


In a post titled Real vs Nominal, Winterspeak writes:

Lots of activity in recent comments about the distinction between "real" vs "nominal". Here's my take:

Short version: "Real" equals atoms and/or sweat. "Nominal" equals a number in a spreadsheet.

Longer version: Real pertains to real goods and services produced by an economy... Nominal equals a number in a spreadsheet...

An inflation adjusted nominal term is not "real", because it is still a number in a spreadsheet...

At an economy wide level, if nominal incomes increase faster than real production, there is a risk of inflation (unless that extra income is "saved" and becomes, essentially, dead money).

If nominal income increases faster than real output, there is risk of inflation. Sure, I buy that. It's the old "demand-pull" story that, although still true, no longer applies to our economy. But that's not at issue here. I'm trying to get at something simpler.

I highlighted the relevant passage, and commented:

Looking at:
At an economy wide level, if nominal incomes increase faster than real production, there is a risk of inflation...

How can we know whether nominal incomes are rising faster than real production? We would have to measure real production and somehow convert it into numbers in a spreadsheet.

Winter says An inflation adjusted nominal term is not "real", because it is still a number in a spreadsheet... To me this means: You cannot compare nominal income to real output, because real output won't go into the spreadsheet.

Neil quoted my question, and offered an answer.

"How can we know whether nominal incomes are rising faster than real production"

By monitoring inflation.

I understand the principle, and I accept it. That's not at issue. I am pointing out that, as Winterspeak says, "real" output cannot be converted into numbers. So it cannot be used in a calculation to determine whether nominal income is increasing faster than real output.

Winterspeak sets up an equation:

inflation is proportional to income over output

I'm just pointing out that we don't have the numbers, so we can't do the math.

Neil assumes the equation is correct, and says that the answer -- inflation -- is evidence of what the numbers must be. I also assume the equation is correct. But I don't assume it applies to our situation, and I don't assume there is no other cause of inflation.

Given the assumptions I do not make, it becomes necessary to either measure real output or set the equation aside.


Winterspeak says that if income grows faster than output, the result is inflation. Neil says you can tell from the result whether income is growing faster than output. To me this is circular reasoning.

I summarized our exchange and brought it forward a step:

Q: How can we know whether nominal incomes are rising faster than real production?

A: By monitoring inflation.

Q: Circular. Moreover, this approach does not account for the growth of credit-use in place of income.

Wow! I raise doubt about the logic underlying the inflation equation, and immediately offer evidence showing that other factors are involved and that the equation is incomplete.

Unfortunately, it was my last comment that was incomplete. I didn't write Circular reasoning. I just wrote "Circular." And then Winterspeak said to me:

Good point -- horizontal OR vertical money expansion in excess of real production can generate inflation (but the vertical growth of course can also be absorbed as desired savings).

Nevertheless, the circularity you criticize is a feature, not a bug. The desire for the non-govt sector to save changes. It is the exogenous variable.

"Vertical money expansion" is when the Federal Reserve increases the money supply, if I have it right, and "horizontal money expansion" is when private banks and borrowers increase the quantity of credit in use. So Winterspeak's first paragraph there is a reply to mine beginning "Moreover, this approach." That leaves us with my single word "Circular" and Winter's response to it.

"The circularity you criticize is a feature, not a bug," Winterspeak says. I'm not sure what he is talking about there. I think it is about "circular flow of income" or something. It is surely not a defense of circular reasoning.

So anyhow, I guess I blew the whole thing. It was so clear to me that the defense of the inflation equation is a circular argument, that I wouldn't spend two words on it. I didn't say "Circular argument." I just said "Circular," and nobody understood. I blew it.

So much for my New Years Resolution to be more explicit.


The title of this post is a phrase from Maynard, from the Preface of the General Theory. This note is your clue as to who I am quoting tomorrow...

Friday, January 14, 2011

"GM Sold More Cars in China than USA Last Year"


...reported by Emmaco News Update.

Some ads in my email

Took me a while to figure out what's going on here.


Screen capture from 15 November 2010:


Screen capture from 6 December 2010:


Screen capture from 9 January 2011:


I wonder how many months it took me to catch on.

// update 4 Fed 2011:


I guess my post didn't embarrass them into stopping that garbage.

Thursday, January 13, 2011

Niskanen and Cato, with some Taylor on the side


The little advertisement at right showed up alongside the Cato Niskanen article that I touched on in the previous post. I was particularly struck by the wording of the advertisement:

For many people, owning a business is the American dream, but attaining that dream has grown increasingly difficult due to laws and regulations that interfere with an individual's right to earn a living.

See, I would change it there, right after the words "due to."


Here, let me excerpt a few highlights from Niskanen's 10-year-old Cato post:

The U.S. economy is now in its 10th year of sustained growth. Moreover, the growth rate has been unusually high and the inflation rate unusually low...

What explains this long boom?

...a substantial part of the credit for the long boom is due to the long period of unusually effective monetary policy...

A second set of policies contributed to the long boom but with a less consistent record--the substantial reduction of domestic economic regulation and the barriers to international trade.


Niskanen goes on to point out that deregulation began in 1978 under "the Carter White House" and continued under Reagan and Clinton, but not Bush I.

So, where does the story come from, that "laws and regulations that interfere with an individual's right to earn a living" are the perennial problem? Did Bush II bring back regulation in his 8 years? Yeah I can see Cato would want to put that on Obama. But he's barely got two years in. As I see it, the book ad contradicts the Niskanen article.

Niskanen's right: We deregulated for near 30 years.


Recently, John Taylor was the invited speaker at the joint luncheon of the American Economic Association and the American Finance Association -- "a very large affair." Taylor spoke in favor of rule-based policy, as opposed to discretionary policy. He said in part:

I could list many more examples of deviations from rulesbased policy in recent years if I went beyond monetary and fiscal policy and considered regulatory policy. Most glaring was the failure to enforce rules about risks at certain large financial institutions, including commercial banks, the most highly regulated entities in the financial system, and to even encourage excessive risk taking by Fannie Mae and Freddie Mac.

We failed to enforce the rules: Regulations were abandoned. We deregulated.


It is the absurd and grotesque accumulation of private-sector debt, eating into profits and eating into income, that interferes with our success in business and undercuts our creature comforts at home. Debt, not regulation. Excessive private-sector debt.

And there is no economic policy designed to reduce that debt.