Showing posts with label Adjusting debt for inflation. Show all posts

Monday, January 16, 2017

The evolution of Real Debt growth, 1948-1993


Real Debt did not run flat until the 1980s and then suddenly explode. It was always rising.
The graph shows Federal debt because I had that graph handy. But the acceleration of debt growth is similar for private debt and for total (public plus private) debt.

The animated GIF was easy to create from individual GIF images at gifcreator.me.

Thursday, January 12, 2017

Use


This graph shows the Gross Federal debt, nominal and real:

Adjusting the Federal Debt for Inflation
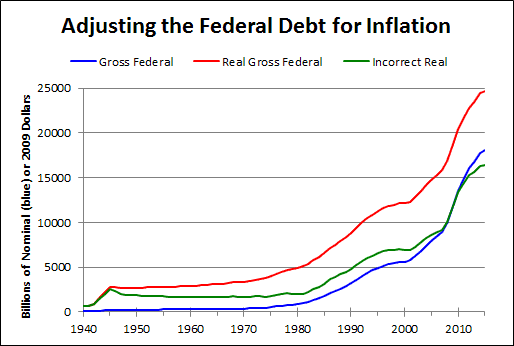
Graph #1: Federal Debt (blue) and Its Inflation Adjustments, Right (red) and Wrong (green)
Nominal (blue) is useful for figuring the payback of debt. Real (red) is useful for figuring the boost that credit use gives the economy. The third calculation (green) is wrong and should not be used. These rules apply not only to government debt, but to all debt.

Wednesday, January 11, 2017

Would it matter?


Some people use an incorrect inflation adjustment of debt and produce a line like the green one on this graph:

Graph #1: Federal Debt (blue) and Its Inflation Adjustments, Right (red) and Wrong (green)
See how nice and flat the green line is, from the 1940s to the early 1980s? People see that and say those times were good because the debt stayed low. Then debt "exploded" in the 1980s, they say.

It's the wrong calculation. The green line is wrong. The red line correctly shows inflation-adjusted debt. Debt started going up in the 1950s, not the 1980s.

Look, I don't want to argue the point. I just want you to think about it. If you were making decisions and setting economic policy, would it matter if you thought debt started going up in the 1980s but it really started going up in the 1950s?

Would it matter? Answer that question first. If you think maybe it would matter, then maybe you should look into whether the green line really is wrong, as I say.

Tuesday, January 10, 2017

As a graph-maker ...


After I wrote yesterday's post and showed the "national debt (adjusted for inflation) since George Washington" graph, bluemexico's graph, I went and made my own graph right away.
Adjusting the Federal Debt for Inflation
Graph #1: Federal Debt (blue) and Its Inflation Adjustments, Right (red) and Wrong (green)
I didn't work out the numbers for each President, and I only went back to 1940. So my graph is only roughly comparable to bluemexico's, and only to the last part of it. This part:

Graph #2: The Last Part of Yesterday's Graph
The graphs differ some. Mine shows the data once for each year. Bluemexico's shows the data once for each President. The graphs show the same general path but are not identical.

But the two are close enough I can tell that bluemexico adjusted the debt for inflation using a calculation like the one that is used to adjust GDP for inflation. His graph shows the same pattern as my green line: It shows a peak in 1945. Then it falls a bit. Then it runs flat for the rest of the '50s, the '60s, and into the '70s. On mine, into the '80s.

Compare the green line to the red in the years before the mid-1980s, or the green to the blue, and it is easy to see that the green is the flattest of the three. That flatness is the result of the way inflation is taken out of the debt numbers.

What's wrong with the green line? Debt accumulates over many years. The effect of inflation on debt depends on what year the money was borrowed. But the calculation for the green line pretends that the whole accumulation was borrowed in a single year: in 1970 for all the debt accumulated up to 1970, in 1980 for all the debt accumulated up to 1980, and like that.

I know, I know. I hope I don't still have debt left over from 1970 or 1980. Still, the graph does show the debt of those years. And if the graph shows it wrong, people get wrong ideas about debt and the economy. That leads to flawed analysis and bad policy.


Here is a post on how to adjust debt for inflation.

Monday, January 9, 2017

You don't even know the size of inflation-adjusted debt until you get the calculation right


I keep going back to this graph:

Graph #1: Federal Debt by President, from Washington to Obama
You can click the graph to see it bigger and more readable. You probably don't need to, as the plotted line is easy enough to see. Also you may not want to, if your closed mind has already dismissed my topic as meaningless and unimportant. Me, I'm still trying to figure out what my topic is.

I keep going back to that graph because it shows debt adjusted for inflation. I wonder why they bother. They're not looking at debt relative to anything but the price level. All they are showing is that debt went up more than prices went up. It's an odd focus, don't you think?

Oh, I forgot to say: The graph is from Reddit, from the The_Donald subreddit, from a page titled A look at our national debt (adjusted for inflation) since George Washington became President in 1789. Obama will have added almost $9 trillion to our national debt by the time Trump takes office. It has 4082 thumbs up and 442 comments.


I searched that page for the phrase adjusted for inflation and found two occurrences: one in the post title, and one in a critical comment by imfineny:

I think it would be more informative to plot it against GDP adjusted for inflation

Mm. I wonder what sort of information the guy expects to find in the graph he imagines. (I briefly wonder why he doesn't just create the graph that he wants to see. I guess he doesn't want it that much.)

If the adjustment of debt for inflation is done using the same calculation used to adjust GDP for inflation -- as it almost always is -- then the debt-to-GDP ratio comes out the same whether the values are adjusted for inflation or not. It is incorrect to use the same calculation for debt as for GDP, of course. But I doubt those guys at Reddit are aware of that problem.

If they were, I expect they would focus more on getting the calculation right than on the size of the debt. Because you don't even know the size of the debt until you get the calculation right.

And now we have discovered my topic.