 |
| GRAPH #1 FROM YESTERDAY'S POST |
Given that we have the federal debt we have, what would GDP growth have to look like, to make the blue line keep going downhill like the red line?
I can use the federal debt and the exponential trend to calculate the GDP growth that would have been required to keep the blue line on the same path as the red line. And then I will look at this hypothetical GDP growth and see what there is to say about it.

Done. The "Hypothetical GDP" numbers are calculated in Sheet 2 of my Google Docs spreadsheet.
What to say about it? So far, my only impression is that the numbers get big. But I always get that same impression from looking at actual GDP numbers. So...
I want to take this hypothetical GDP and take inflation out of it. I can use the GDP deflator I guess; I have nothing else.
This assumes that nothing else changes. That's kinda silly: Nothing changes, except the GDP is way bigger. But again, I have no other way to remove the inflation. Anyway, this whole exercise was hypothetical from the start.
I can get "GDP Deflator" numbers from Measuringworth.
Ahh, but Measuringworth does not list the "TQ" there between 1976 and 1977. So now it is time to delete the "TQ" row from the Federal Debt and Hypothetical GDP columns.
I'm thinkin that might put a slight kink in my exponential curve. So be it.
Okay. Over in Column K on Sheet 2 I have Hypothetical "Real GDP". It is time to stop using the word "real" to mean "inflation-adjusted." If ever there was an example of why the word "real" is the wrong word to use, this is that example.
Also, it is too much typing to call it "Hypothetical GDP" every time. I'm gonna change this from "Hypothetical Gross Domestic Product" to "Gross Hypothetical Product" or GHP.
I will copy over these inflation-adjusted Hypothetical GDP numbers to a new worksheet, where I will label the column Inflation-adjusted GHP.
Sheet 3 shows the inflation-adjusted hypothetical output numbers. Still not sure where this is going. I want to look at the annual growth rate of this hypothetical, inflation-adjusted GDP. I think I want to compare it to the old "potential GDP" numbers. But I don't know what the result will be.
I want to point out that I'm writing this post as I develop the spreadsheet numbers. I do expect that GHP, hypothetical output, will not be outlandish. Because everything I know about the economy from other graphs I've done leads me to expect such an outcome. But I don't know that, yet.
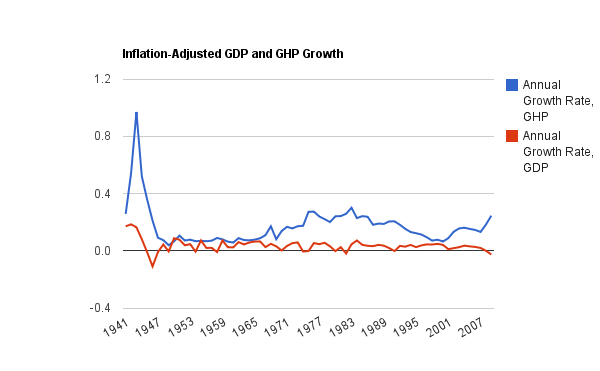
So let's look at a graph of the annual growth rate of GHP.

Wow, these numbers are up there! Ignoring the WWII spike, there's a big lump in there reaching 25% annual growth, around the dates 1977 and 1983. Even where it's low, 1953-1959-1965, the spreadsheet numbers are in the range of 6 or 7 or 8% annual growth of GDP. That's more than I expected.
You can also see on this graph a downtrend from 1983 to 2001, the Reagan-Bush-Clinton years when the federal budget worked its way toward balance.
This graph shows how much GDP would have had to grow, to keep the federal debt a declining percentage of GDP. The calculation is based on the years 1955-1973, when the federal debt was in fact a declining percentage of GDP. On this graph, 1955-1973 includes the low years, but also includes the rise toward that 25% level.
The spreadsheet numbers for 1973 and 1974 are a bit over 17%, meaning a 17% growth rate. Which is ridiculous. Even China doesn't grow that fast.
But what I'm thinkin though, is that this graph should show realistic growth rates for the 1955-1973 period, because that's where the exponential curve matches the federal debt numbers. If you remember, the actual numbers varied back and forth across Excel's calculated trend. So on this graph, in that 1955-1973 range, the growth rates should be very close to actual, inflation-adjusted GDP growth rates. They're not.
Oh, they're closer in the 1950s and '60s than in the '70s and '80s. But that's not what has to happen. The simulated GDP, the GHP, for the years 1955-1973 should be almost identical to the actual GDP for that period. It should be as close as the exponential curve is to the federal debt numbers for those years.
"Given" that we have the federal debt we have, what would GDP growth have to look like, to make the blue line on graph #1 keep going downhill like the red line? For the years 1955-1973 there should be essentially no change at all. The red and blue lines should be almost identical. They're not.

They don't overlap at all, really, except the first year, 1955.
I think there's something wrong with my numbers.
I have to think about this some more.
I'm open to suggestions.

No comments:
Post a Comment