If you're worried (or not) about inflation resulting from the Quantitative Easing of Base Money since the crisis, you might want to be looking at the rate of inflation:
 |
| Graph #1: The Rate of Inflation since 1913 |
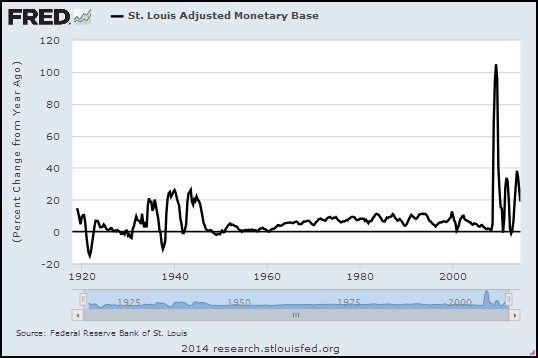 |
| Graph #2: The Rate of Base Money Growth since 1918 |
|
|
Plus, I figured out how to use buttons to move the one graph relative to the other.
You can use the buttons to look for patterns in inflation that match or don't match patterns in base money growth. The "zero year" button aligns the dates of the two graphs, 1930 atop 1930, 1940 atop 1940, and so on. The "1 year" button shows money growth lagged one year; the "2 year" button shows money growth lagged two years; and so on.
The "10 year" button aligns 1930 on the base money graph (black) with 1940 on the inflation (red) graph. You can check the x-axis dates to see what the buttons do.
Even before you click a button, notice that the two lines match pretty well in the early years (up to 1930). After that it's a jumble. So, click some buttons and look for pattern similarities, and have some fun with this thing.
 .png) |
| Graph #5: Base Money Growth (black) Overlaid on the Inflation Rate (red) |
NOTE: If the buttons don't work for you, try this post instead.
Here's what I see: When base money is lagged seven years, the three major increases in base money (1934-1946, black) align remarkably well with three inflationary peaks (1940-1953, red). With a seven year lag.
As I observed yesterday, it is now just six years since quantitative easing began, in September 2008.
During the Great Depression, it took seven years for the unusual pattern of base money growth to be echoed in the inflation pattern. It took seven years, in other words, for inflation to arise as a result of base money growth in the 1930s.
In this post I offer one conclusion: It is still too early to say no inflation will arise from the quantitative easing of our time.

13 comments:
Damn! it took me a year to get around to doing this post.
http://inflationwatch.wordpress.com/2013/08/18/over-stretching-case-for-inflation/#comment-650
Great work Art.
I would like to see some analysis about the impact QE would had under the varying gold standard regimes of the period.
Art -
One hell of a neat trick with the buttons. In playing around before reading on, I also noticed the 7 year correspondence.
But it's very hard for me to believe a 7 year lag for a monetary effect to operate. That is a reach to far, and too much can happen in between. And notice that by 1950, it's no longer operating.
Notice also that at between 2 and 3 years [2.5 would be close to perfect] you get another correlation that might not be as striking, but lasts longer by several years on the front end. But it, too evaporates by 1950.
Beware the coincident correlation. That is the root of many faulty economic models.
Also remember the secular trends. Through the 20's to some time in the 30's we went from disinflation to deflation. Secular inflation kicked in no earlier than 1940.
Where we are now has a lot more in common with the 20's than it does with the 40's.
And I still say that before you can get to inflation, you have to get out of disinflation.
There is no sign that that is happening.
Cheers!
JzB
I just read the link at inflation watch. Dr. Duru is deeply invested in an inflation scenario, but can't figure out how to validate it.
I think his lack of success it telling.
Cheers!
JzB
Jazz -- Tomorrow's post is just a quote from somebody I agree with. (You might be surprised!)
For the next day my topic is to look at the various lag times that you mention here.
I don't think it is coincident correlation. I think it is a sudden and temporary (in geologic time) change in the "metabolism" of the economy. A massive slowdown. I think, looking at the changing lag, we can *see* the economy slow down and then pick back up again... it "evaporates by 1950" as you said.
I understand the "it's very hard for me to believe" thing. A lot of what's happened in the past several years is easy to believe only because it has already happened.
Art
Can you share your thoughts on what the transmission mechanism is for base money to make it way into the inflation graph.
No, Oilfield, but I can tell you that the post is an exploration of empirical relationships.
Art
I like reading your blog because we seem to shart a passion for the exploration of empirical relationships. At the end of the post you drew a conculusion about the relationships and I was just curious how you were connecting the dots.
"An Interactive Inflation Experiment" follows and builds on "The Writers Versus the Signatories". That earlier post looks at the writers' dismissal of the signatories' view of "the risks associated with the bank’s policy of quantitative easing". The writers' objection to the signatories' view (or at least the one that stood out to me) is this:
Four years later, the economy is doing better and we still don't have inflation.
My objections to the writers' view are
1. The economy isn't doing as well as the writers try to make it sound.
2. The writers suggest that we will be able to avoid inflation BECAUSE the economy improves. But they have it just backwards. When the economy improves, when the economy grows, the threat of inflation becomes greater, not less. And
3. The writers' view is that we've waited long enough: We didn't get inflation, so we won't get inflation. But this view is not based on anything that I can see. So I wanted to look at the last time the economy was in a situation like we're in now. And the "Interactive" post is my look at that situation.
The signatories' view is that QE risks "currency debasement and inflation". The writers' view is that we've waited long enough, and we can now say there is no risk of inflation from QE. The writers reject the signatories' view, claiming that enough time has gone by. In the "Interactive" post I show that enough time has not yet gone by. And that is my conclusion, that you ask about.
The signatories connected the dots. The writers accepted the connection and shot down the signatories view based on elapsed time. I show that the "elapsed time" argument is incorrect.
Before 2008 the monetary base consisted of mostly currency that people carried in their wallets and purses or drug lords carried in suitcases. The Fed actually had practically zero control over the size of the monetary base. To claim the Fed influenced the size of the monetary base would involve demonstrating that the Fed had mind-control over the amount of currency that people chose to withdraw or deposit with banks.
Today its different, most of the monetary base sits in reserve accounts at the Fed. That means the Fed does have control and can liquidate that portion of the monetary base if it wants to. If the Fed would do that, it would reverse the process of creating deposits and the economy would see a sudden drop of several trillion in the M2 stock of money.
As a thought experiment you might consider what effect such an action by the Fed that created a huge drop in the M2 money supply would have on inflation.
1. The economy isn't doing as well as the writers try to make it sound.
True
2. The writers suggest that we will be able to avoid inflation BECAUSE the economy improves. But they have it just backwards. When the economy improves, when the economy grows, the threat of inflation becomes greater, not less.
No. This is a misreading. They are saying that the economy has improved, and we STILL do not have inflation, so the signatories were wrong, and Krugman was right. They were wrong then and they're derp-diving now.
Their other prediction was currency debasement, and look what happened.
http://research.stlouisfed.org/fred2/graph/?g=Ndt
The dollar index had been sliding since 1985. It has since stopped sliding, and might even be reversing. They also got that exactly wrong.
3. The writers' view is that we've waited long enough: We didn't get inflation, so we won't get inflation. But this view is not based on anything that I can see. So I wanted to look at the last time the economy was in a situation like we're in now. And the "Interactive" post is my look at that situation.
Per your Friedman quote, 2 years is plenty of time, so 4 years is over-kill.
What it's based on is that there is no sign of inflation picking up. After a local maximum in April 2012 at 2.32%, it has been in a slow but steady decline. It has to crawl before it runs, but it's still falling.
You aren't looking at a situation like we're in now. I don't know of any situation comparable to now. The 20's might come close. The 30 and 40's were drastically different. We're at the ZIRB, with fiscal austerity, record corp profits, and record low tax rates.
Cheers!
JzB
Art
Thanks for the response some of my thoughts
“The signatories connected the dots. The writers accepted the connection and shot down the signatories view based on elapsed time. I show that the "elapsed time" argument is incorrect.”
Seems to me the signatories are data shopping to camouflage an a priori argument into a posteriori argument and the writer could not see through the camouflage and conjured the “elapsed time” framing to poke a hole in the argument.
He could have simply stated that no reliable empirical evidence exist that simply increasing base money will cause inflation and been done with it.
In my exploration of empirical relationships of a complex dynamic monetary system, arguments which rest on lags and leads of more than 12 months throws up red flags, and the probability the relationship exits drops significantly the longer the lag or lead is.
QE is nothing more than an asset swaps between the Fed and the Private Sector. With the FED merely swapping assets they are not actually "printing" any new money.
In fact, the FED is now essentially transferring interest bearing assets from the private sector and replacing them with low interest bearing deposits and reserves.
This might have made some sense when the credit markets were frozen and bank balance sheets were thought to be largely insolvent, but now that the banks are flush with excess reserves this policy response would it be deflationary - not inflationary since it reduces any interest income flows from the private sector to the public sector.
Is QE good monetary policy? I think it is much to do about nothing.
Bill Gross was a rock star hero in the fixed income universe, but his bearish view on Treasuries, due mainly to his misunderstanding of what QE does, has almost turn him into a zero.
Oilfield Trash: "He could have simply stated that no reliable empirical evidence exist that simply increasing base money will cause inflation and been done with it."
Indeed he could. But that would have been much less interesting.
"In my exploration of empirical relationships of a complex dynamic monetary system, arguments which rest on lags and leads of more than 12 months throws up red flags..."
Okay, but if the Great Depression was (say) seven times as severe as the average recession, then perhaps seven times 12 months is reasonable after all. And the red flags would be entirely appropriate because it's a depression, not a recession after all.
Post a Comment