Showing posts with label Gross Domestic Spending. Show all posts

Tuesday, July 8, 2014

Gross Domestic Spending: Documentation


This post provides links to two Excel files and eleven short PDFs. The "GDS Data Series" file is outputs, the result of my industry. The "Business Population" file is inputs, the source data that I used.

The GDS Data Series.xls file is an Excel file generated by OpenOffice Calc. The file contains one sheet. The first two columns of the sheet contain the year and GDS values. Columns farther to the right document the calculations used to come up with the numbers.

The Business Population.xls spreadsheet is an Excel file generated by OpenOffice Calc. The file contains two sheets. The Data Entry sheet lists the source files and data values obtained from them. Columns further to the right are notes on units and on the column headers, which evolved a bit over the years.

Note that there is some duplication of data on this sheet, as I was comparing the values provided by newer and older sources at the overlaps. This duplication is eliminated from the other sheet in the file.

The other sheet in this file is named ArtS Data Series. This sheet lists the source file, the year, and "Number", "Receipts" and "Net Profit" for total business enterprises -- that is, for sole proprietorships, partnerships, and corporations, combined -- for 1959 through 2008.

In order to document the source data for the GDS series, I extracted individual pages from various source PDFs. The extracted files are typically one-page PDFs. To extract the relevant pages I just printed them to doPDF.

The 12s0744.pdf isn't mine. I found it on the web. Somebody else was thinking along the same lines I was, apparently.

All files are stored on Google Drive, the old Google Docs.

PDFPAGESPERIODSOURCE
HS70 V 1-1211959-1966Historical Statistics (Bicentennial Ed.)
SA74 Table 77511967-1968Statistical Abstract (1974)
SA76 Table 82311969-1971Statistical Abstract (1976)
SA78 Table 91511972-1974Statistical Abstract (1978)
SA85 Table 86811975-1979Statistical Abstract (1985)
SA89 Table 84611980-1984Statistical Abstract (1989)
SA92 Table 82711985-1987Statistical Abstract (1992)
SA2000 Table 85511988-1994Statistical Abstract (2000)
SA0405 Table 71611995-1999Statistical Abstract (2004-05)
SA09 Table 72212000-2003Statistical Abstract (2009)
12s074412004-2008Statistical Abstract (2012)
Table Style by TextFixer.com

The source PDFs (large files) are still available from census.gov, but the 2012 Abstract is the last one they issued.

You know, spending cuts.

Monday, July 7, 2014

Preliminary notes: What does it mean when GDS increases relative to GDP?


I showed this graph on 2 July:

Graph #1: Gross Domestic Spending as a Percent of Gross Domestic Product
It turned out that the raised area, in the 1970s and thereabouts,showed a fair similarity to the rate of inflation in those inflationary years.

Got me thinkin'

//

GDP is Gross Domestic Product, the the sum of final spending in our economy in a year. GDS is Gross Domestic Spending, the total of final and non-final spending in our economy in a year. The increases in GDS are measured in dollar volume, not "number of transactions" or any such thing. It's a dollar number. So if GDS increases it is because spending increased, plain and simple. Same with GDP.

One major effect of a change in the GDS/GDP ratio would seem to be a change in spending pressures -- that is, inflation pressures.

//

Whatever cause may lie behind the increase in spending, then, one fact remains: the spending increased. The trend of GDS/GDP, then, in the 1970s, was that costs increased faster than income: GDS increased faster than GDP.

If this is correct, I must be able to see it in business profits -- perhaps profits relative to GDP, certainly in profits relative to expenses.

I'll take that challenge.

Graph #2:Total Business Deductions Peak in 1982 as a Share of Gross Income
Yeah. It stands up to the challenge. Spending increased faster than revenue until 1982, and more slowly after that year.

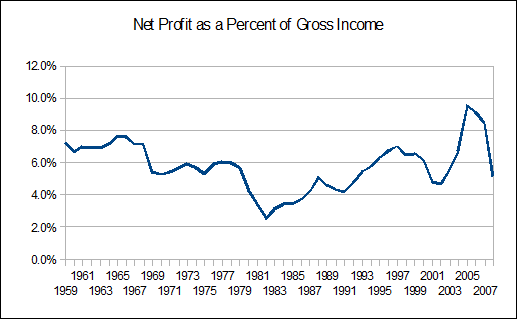
If deductions rose till 1982 and then fell as a share of revenue, then profit must have done the opposite:
Graph #3: Business Profits hit bottom in 1982, Trending Upward Thereafter
That should come as no surprise.

Profits tended down until 1982, and up thereafter.

Sunday, July 6, 2014

In case you missed it yesterday


A comparison of gross output, the output consumed by production, and the net output that remains, as against Gross Domestic Product and my measure Gross Domestic Spending, which adds nonfinal business spending to GDP:

Here's the picture:

Graph #2
The blue line is U.S. Gross Output -- the measure of what we produce in a year.

The red line is intermediate consumption -- the measure of output consumed in the process of producing output. It is almost half Gross Output. The red is almost half the blue.

The green line is output left over after using up output (red) to produce output (blue). The green line is just a little over half the blue. The red line is just a little under half; the green is just a little over.

The gold line is GDP. It is approximately equal to the green. The gold line, we call it "gross" domestic product, but really it is the part of output left over after using output to produce output. Almost the same as the green line. It differs for reasons you can read at Wikipedia.

The brown line is Gross Domestic Spending. It is GDP plus the business spending that is written off as tax deductions in the process of producing output.


Data sources for Graph #2 --
Blue, Red, Green: UNSNA via UNdata.
Gold: FRED.
Brown: Arthurian.

Here's the Zoho.

Saturday, July 5, 2014

UNSNA: US Gross Output 1987-2011


UNSNA is UN SNA, the United Nations System of National Accounts. Like NIPA. Except "NIPA" is pleasing to the ear, and "UNSNA" sounds like something you'd wipe off with a kleenex.

I googled unsna data historical and found System of National Accounts 2008 - United Nations ... so I went there looking for data. I clicked DATA on their blue menu bar. That brought me to their National Accounts Data page. Text and links. At the end of the second paragraph is a link to UNdata. That's the one you want.

I suppose I could eliminate the previous paragraph and just give you the UNdata link direct. But I'm trying to give you a sense of the struggle, perseverance in the search for data. (Plus, I write this stuff down so I can find my way back later.)

Anyway, the UNdata page has a search box, so now we're making some progress. I searched for gross output. I got two hits. Two is good. What the hell am I supposed to do with 13 million hits?

I take Table 2.6 Output, gross value added and fixed assets by industries at current prices (ISIC Rev. 4) because it has 91124 records. The other one (ISIC Rev. 3) must be older, and has half a million records. Maybe I'll look at that later.

Now we're getting to the meat. The Rev. 4 link gives me this:


The main body of the default page is a table of info about Armenia. It consists of several columns of info I don't want. But there are select filters scrollboxes on the left. The first one is countries. So I can look at U.S. data instead.

Their scrollbar is neat. You just hover over the little down-arrow, and the list of countries scrolls, slow enough you can read it but not so slow that you're bored.

In the second filter box you can pick years for data. I want all the years, naturally.

Now the important part that you must not miss:

Just below the second filter list there is a link that says More. You'll want to click that. It lets you zoom in closer to the data you want.

Click the MORE and you get two additional filter boxes. At the top of the third box is "total economy". That's the one I want. The other options are industry-specific. I want big-picture.

The last filter box lets you pick the data you want to see. That's a big deal. Basically, I wanted the first three that appear in the filter window, the ones I saw at Wikipedia yesterday: Gross output, intermediate consumption and gross value added (the last of these being approximately equal to GDP).

Oh, and most important, be sure to click the Apply Filters link. It's below the last filter box. That's the magic that makes UNdata do what you want.

Oh -- funny thing. While writing this post I was going through the motions to verify the steps. But I didn't pick the country and the years before I clicked MORE. Then after I told you about all four filters, I tried to pick the U.S. and follow through the process. But the thing wouldn't let me pick the U.S. The list of countries scrolled down as far as the S's and no further.

I clicked LESS to go back to the two-filter screen and tried again. No good. But I refreshed the page, and then it worked okay. (In case you run into trouble using the thing.)


When I was done selecting my filter options I clicked APPLY FILTERS and the screen changed to show the data I wanted to see.

And if you don't know about CSV...


As the first of the UNdata screen-captures shows, across the top above the table of data are options including DOWNLOAD and SELECT COLUMNS. Both look useful.

I used DOWNLOAD, which gives some format options. First time, I tried XML. But when I loaded it into OpenOffice Calc I got a blank spreadsheet. So then I tried the "value separated" option identified as "comma" (Sheesh! What an awkward way to say CSV) and it worked fine. Gave me a ZIP file.

Had to extract the data file from the zip before I could use it. (I just put it on my desktop along with everything else.) Then I right-clicked the data file and picked "open with" OpenOffice Calc. A "text import" window opened. I checked COMMA and unchecked TAB (or something like that) to make the sample import look right, then clicked OK.

OpenOffice Calc opened the file right away. Excel would be as easy, maybe easier.

Now we're getting to the meat.


I saved the spreadsheet right away, in spreadsheet format. Otherwise, it stays as a CSV file. And CSV files can't save the formatting that spreadsheets do, so the next time you open the thing most of your changes are gone. Save it in spreadsheet format, and you solve that problem.

I bolded the column labels in row 1, set column widths, and made the text in column C wrap automatically. (That's the kind of formatting you lose if you keep the file as CSV.) Then, because I wasn't careful with the import, I had to go into column F and delete a single-quote from in front of the number, on every row.

Also, I deleted some columns that UNSNA thinks important and I don't. Then I uploaded it to Zoho so you can see what the thing looks like. Here's the Zoho:


The filename was set by the UNdata exporter.

The first row identifies the columns. Look at rows 2, 3, and 4, column C. There you have output, intermediate consumption, and gross value added (all for 2011, as column D shows). The next three rows have the same three items of data for 2010. The rows continue like that, back to 1987. Then, from 1986 back to 1970 the only data item is gross value added. Before 1970, nothing.

Still, we've got three items of data for the years 1987 to 2011. Not a bad start.

The biggest problem I have now is that all the numbers are in column F. That means I can't copy a chunk of numbers and get just gross output or just intermediate consumption or something. I get a jumble. In order for the data to be useful, I have to separate it into different columns by type (so I get three columns of data rather than one) and also combine the three rows for each year into one row. Then I get ONE row for 2011 with three columns of data, and ONE row for 2010 with three columns of data, and ONE row for 2009 with three columns of data... I could go on, but I think you get my drift. It's obvious, isn't it?

So why doesn't UNdata know this? I think they DO know it. They're not stupid. Maybe they just want to make it difficult. Hey, I've never seen this data used anywhere. Why not? I think people are discouraged from using the data because it is so much work to undo the stupidities built into it by people who surely should know better. I'm beating around the bush here, trying to avoid being explicitly rude.

Oh, well.

If you scrolled the spreadsheet enough to see column F, you saw that the numbers are given in dollars. I mean, if the value is 27,170.5 billion, UNdata gives it as 27,170,500,000,000. That's not easy to read; you have to count digits. So I want to convert their numbers to billions. The numbers will be easier to read that way, and compatible with FRED's numbers.

That, and I want to convert the three-row-one-column format to one-row-three-columns, so the data is useful.

Now we're getting to the meat.


I copied the original data (Sheet1) to a new sheet to make the changes.

Figured out a calculation to move the data for me into the format that I want. It's in the first few columns of Sheet2 in this Zoho file. (It only applies to the data back to 1987, where there are the three different values for each year. For 1986 back to 1970 I just copied and pasted the range of cells.)

Turns out that, like my column F values, my year values had the single-quote mark that left-justifies them and makes them behave like text instead of numbers. Next time I'll have to be more careful with the import from CSV.

I copied Sheet2 to make a new sheet and called it Sheet3. On the new sheet I copied the first few columns and pasted them as values over top of the calculations. After that I could delete the source data that was formatted badly, clean up the sheet, and credit UNdata for the data.

And of course, they also present the data backwards, newest first, rather than chronologically. I sorted that. Here's what I have so far -- data now ready to use.

Now we're getting to the meat.


Now I was ready to look at the numbers.

Graph #1

I noticed Wikipedia said

In the US economy, total intermediate consumption represents about 45% of Gross Output.
That's about right, for the blue line, since 1997 or so. More like 42% before that. And it looks like a trend of increase (for the blue line) and decrease (for the red).

Also... when you say "average" it suggests up-and-down variation, but it also implies stability in the value. If intermediate consumption is trending upward as a share of gross output, it is deceptive to speak of its average value. Would be nice if the values went farther back in time, so one could be more certain about trends.

Now we're getting to the meat.


Another thing the Wikipedia article said was that "gross output" is what we produce in a year, but we use up "intermediate consumption" in the process, which leaves us with "net output" which his just about the same as "GDP". That's four different data series right there.

To those four I want to add my context variable "GDS", gross domestic spending. That gives us five series to look at on one graph. You with me? Usually if I have more than two lines on a graph I start to lose clarity. This time it's five. But we're only looking at their relative sizes. That's straightforward.

The source for this graph is the same file as the Shares of Gross Output graph above. It's on the next tab to the right, so you can look at the numbers if you want. Here's the picture:

Graph #2
The blue line is U.S. Gross Output -- the measure of what we produce in a year.

The red line is intermediate consumption --  the measure of output consumed in the process of producing output. It is almost half Gross Output. The red is almost half the blue.

The green line is output left over after using up output (red) to produce output (blue). The green line is just a little over half the blue. The red line is just a little under half; the green is just a little over.

The gold line is GDP. It is approximately equal to the green. The gold line, we call it "gross domestic product", but really it is the part of output left over after using output to produce output. Almost the same as the green line. It differs for reasons you can read at Wikipedia.

The brown line is Gross Domestic Spending. It is GDP plus the business spending that is written off as tax deductions in the process of producing output.


Data sources for Graph #2 --
Blue, Red, Green: UNSNA via UNdata.
Gold: FRED.
Brown: Arthurian.

Friday, July 4, 2014

"Gross Domestic Spending" is not "Gross Output"


So I was rummaging around the internet, looking for other people's use of the term "gross domestic spending". Among the first few hits I found something that confused me. I couldn't tell if it was relevant to my topic. I had to take another look.

The puzzling piece was in the Production approach section of the Gross domestic product article at Wikipedia. The confusion arose because they explained one thing that I didn't know about in terms of two other things I didn't know about:

Gross value added = gross value of output – value of intermediate consumption.

Reading it over (more than once) helped. Realizing that "gross value of output" was the same as "gross output" helped. Reading someone else's version of it helped, too:
Gross output is an economic concept used in national accounts such as the United Nations System of National Accounts (UNSNA) and the US National Income and Product Accounts (NIPA). It is equal to the value of net output or GDP (also known as gross value added) plus intermediate consumption.

I'd swear I read that the NIPAs don't use the "gross output" concept, but I can't find the reference now. No matter. "Net output" equals "gross value added" equals GDP, they say. That helps me tie things together.

So Gross Domestic Product is net output. Reminds me of Jim's question: So what do you call gross spending? Do you call it Gross Gross Domestic Product?

The Wikipedia page links to their Intermediate consumption page, which also helped:

Conceptually, the aggregate "intermediate consumption" is equal to the amount of the difference between Gross Output (roughly, the total sales value) and Net output (gross value added or GDP). In the US economy, total intermediate consumption represents about 45% of Gross Output.

Okay, I was at last mentally prepared to deal with the idea of "Gross gross domestic product" -- of a quantity bigger, more general, more "gross" than GDP. GDP is "net" output, after some other output is used up producing it. The part that gets used up is "intermediate consumption". The part that remains is GDP. And the total of the two is "gross output".

Forty-five percent, they say: "Total intermediate consumption represents about 45% of Gross Output." How can I make use of that fact?

Gross Output equals 100% of Gross Output. Intermediate Consumption is 45%. And GDP is what's left. So GDP is about 55% of Gross Output. Pretty remarkable, don't you think? Gross Domestic Product is barely half of Gross Output.

How does this compare with Gross Domestic Spending? Well, GDS is about three times GDP. Gross Output is about two times GDP. So Gross Domestic Spending is bigger. Let me see...

Gross Output is 100% of Gross Output. GDP is about half of that, or 55%. And Gross Domestic Spending (as we saw the other day) is a little less than three times GDP. Three times 55 is 165. A little less, so say 150. So Gross Domestic Spending is about 150% of Gross Output.

So if you were wondering what businesses spend all that money on, something like two times GDP, well, "intermediate consumption" explains half of it.

But don't forget: The part of GDS that is all tax deductions is twice the size of GDP.

Thursday, July 3, 2014

"Gross Domestic Spending" is not "Gross National Expenditure"


After coming up with the very satisfying description "Gross Domestic Spending" it took me a few days to Google the term. I didn't want to discover that someone else was already using it to mean something else.

Gross Domestic Product is all the stuff produced here in a year, or all the final spending we do in a year. (That's what you'd think, anyway.) Gross Domestic Spending is all the spending it took to produce all that stuff, that year. It's a really good term. It has symmetry -- the "G" and the "D", I mean. And the product is the product, and the spending is the spending. The meaning is just very clear. That's what I think, anyway.

And if you repeat the phrase a few times, it starts to seem natural. "Gross Domestic Spending" seems a more natural term to me now than "Gross Domestic Product". I like that.

But Google it I did. I think I'm safe. The term doesn't seem widely used for anything else. But I did find a few results.

Actually, I Googled "gross domestic spending" in quotes like that. I should get exact matches. The first result was to Gross Domestic Product (GDP) - Bureau of Economic Analysis but the blurb says "A description for this result is not available because of this site's robots.txt..." That's funny, I think. What is BEA hiding and why are they hiding it?????? Anyway I went to the page and found nothing matching "gross domestic s".

I tried the third result next: BDLive, from Johannesburg apparently. The article talks of "gross domestic expenditure" as if it was GDP, forecasting growth rates and describing the consumer component and like that. Reminded me of something I read at Wikipedia the other day. I didn't read much of either, actually. But we'll come back to that.

The second result is Gross national expenditure (current US$) | Data | Table from the World Bank. Turned out to be worth the click. Under the heading Gross national expenditure (current US$) they offer a definition of sorts:

Gross national expenditure (formerly domestic absorption) is the sum of household final consumption expenditure (formerly private consumption), general government final consumption expenditure (formerly general government consumption), and gross capital formation (formerly gross domestic investment).

Hard to read with all those parenthetical phrases, but okay. It's the sum of final consumer spending and final government spending and investment. Sounds like GDP. Maybe they leave off "net exports". But...

Oh, maybe that's the difference, net exports.

The number they list for the U.S. for 2012 is $16,791.8 billion. The number FRED gives for GDP for the U.S. for 2012 is 16,244.6. FRED's number is 96.74% of the World Bank number. The difference is 3.26%. That sounds about right for loss due to net exports...

I went to FRED to check, and got net exports as 3.37% of GDP for 2012. Pretty close to 3.26%. Close enough. You can do more years and check my work, if you want. If you do, let me know what you find.

Okay, so I'm saying "Gross National Expenditure" is GDP before they figure net exports.

That's not the same as Gross Domestic Spending.

Next, a look at what I found at Wikipedia the other day.

Wednesday, July 2, 2014

Context vs Context


The measure of all the stuff we produce in a year is called Gross Domestic Product or GDP. The measure of all the spending it took to produce that stuff is called Gross Domestic Spending or GDS. That's my name for the context variable I've been developing in the last few posts.

GDP includes final spending. GDS includes final and non-final spending.


I want to compare GDP to the spending it takes to generate the GDP. I want to compare GDP to Gross Domestic Spending:

Graph #1: Gross Domestic Product as a Percent of Gross Domestic Spending
It's about a third. GDP is about one third of GDS. For every dollar of GDP, there was about $2 of preliminary or "intermediate" spending. And that seems fairly stable.

There is a bit of a low spot on the graph, though, in the 1970s. Oh... the 1970s. Let's turn the graph other side up:

Graph #2: Gross Domestic Spending as a Percent of Gross Domestic Product
There. The low spot is now a high spot. In the 1970s. Hm.

Well, what can we say about this graph? It's pretty high up. GDS is in the neighborhood of 300% of GDP, three times GDP. The only other thing I remember being that high is total (public and private) debt. Oh, and maybe private debt by itself, that was up there too. But debt was increasing to get up to that level. Gross Domestic Spending is just *at* that level.

You could finesse this, but I don't think GDS being three times GDP is the thing that created the problem. If it was, the problem would have surfaced long ago. On the other hand, Gross Domestic Spending doesn't vary very much. Yeah, there is a small high spot in the 1970s during the Great Inflation. And yeah, there has been a tendency for the ratio to increase since the 1990s. But only a tendency.

Let me look again. Let me get rid of a lot of the empty space below the blue line on the graph, so the line shows more variation. And let's see how that high spot in the 1970s compares to inflation. I'll add two measures of inflation, the CPI and the GDP Deflator to the graph, on the right hand scale:

Graph #3: GDS as a Percent of GDP (blue) and Two Measures of Inflation
Well, look at that. The spending that generates GDP rose and fell, relative to GDP, in a pattern that bears surprising resemblance to the Great Inflation.

I know what you're thinking: Well, sure. Inflation pushed spending up!

Well, okay. But inflation pushed GDP up, too. There is inflation in both top and bottom of the GDS/GDP relation. Inflation cancels itself out of the calculation. The blue line on the graph does not run similar to inflation because inflation pushed spending up. I think the opposite is true. I think the increase in spending relative to GDP is what pushed prices up.

Tuesday, July 1, 2014

Velocity and the Context Variable


The measure of all the stuff we produce in a year is called Gross Domestic Product, or GDP. The measure of all the spending it took to produce that stuff is called Gross Domestic Spending, GDS. That's my new name for the context variable I've been developing in the last few posts.

GDP includes final spending. GDS includes final and non-final spending.


When economists speak of "velocity" they mean the number of times the money supply must be spent in order to do all the final spending that happens in a year. But I wonder what use that is. Because if they only count final spending, they only count a small part of the spending that happens. It doesn't make sense.

Type velocity in the search box at FRED, and the first thing that comes up on the list is Velocity of M2 Money Stock. It looks like this:

Graph #1: M2 Velocity a la FRED
I want to duplicate it.

I downloaded annual numbers for M2 from FRED and used them to plot "velocity" two ways: using GDP for the numerator, as FRED does, and again using my Gross Domestic Spending number for the numerator. Velocity is higher my way:

Graph #2: The Blue Line of Graph #2 is the Same as the Blue Line on Graph #1
Blue Line: Velocity of Final Spending ... Red Line: Velocity of Final + NonFinal
My blue line shows velocity at about 2 or a little under, just like the FRED graph. My red line shows velocity around 5 or 6 -- that is, 2½ to 3 times higher than the blue. That's what you should expect, as the sum of final and non-final spending is 2½ to 3 times higher than final spending alone.

Monday, June 30, 2014

Confusion and Context


Tracking down Y = C + I + G + NX, I came across an old Steve Roth post: Why Does Y Equal Real GDP?. Roth and correspondents get into a lot of discussion that I want to skirt. My motivating question was: Does the Y represent real GDP or nominal GDP (or does it perhaps represent real output, which is not really the same as any GDP)? Short answer: It seems to be ambiguous at best. That'll do for now.

While I was reading Roth's post and some of the comments I got distracted by a different thought. Let me take you through it.

Roth opens by looking at two macroeconomic identities from a Nick Rowe post. The first of these is the National Income Identity:

Y=C+I+G+NX

C is consumer spending. I is business investment spending. G is government spending. And NX is net exports.

Later in the post, Roth quotes Saturos:

Matt Yglesias (http://www.slate.com/blogs/moneybox/2012/05/13/fun_with_accounting_identities.html) has a new post in which he takes Scott Sumner’s version: MV = C + I + G + NX. That might be the best approach of all – it shows you that all the changes in “income accounting” variables that get reported on the news must all be manifestations of fluctuations in the overall volume of spending, MV.

(Yglesias says Y represents "real output" but doesn't say whether he distinguishes "output" from GDP. The difference? Output is output; GDP is a measurement.)

It stops me cold when Saturos refers to "the overall volume of spending, MV."

Now... Nobody's identifying any FRED series here, so everything is much like the meaning of Y: Ambiguous at best.

Usually, though, M is some quantity of money, maybe FRED's M1 or M2, and V is the value you get when you divide nominal GDP by the M you are using. So MV (or M multiplied by V) is really


The M's cancel out, and you're left with nominal GDP. (This does not answer Steve Roth's question; rather, it seems to be what gave rise to it.)

Back to Saturos. Saturos says MV is the overall volume of spending. And we have just seen that MV is equal to nominal GDP. Therefore, Saturos is saying nominal GDP is the overall volume of spending. That's what stopped me cold.

Nominal GDP is NOT the overall volume of spending. It is the overall volume of final spending, with none of the "intermediate" spending. Nominal GDP is just the cream on top, not the whole bottle of unhomogenized milk. Got it?


Farther down, in the comments, Steve Roth replied to Andrew. Roth wrote:

GDP = Total dollars spent = MV

Again, this is not correct. GDP is not total spending. GDP is final spending only.

Total spending includes both final and "intermediate" spending. GDP includes the final spending, but excludes the much larger intermediate spending. Why count only final spending? Because final spending is the cream, that's why.

I'm not picking on Roth and Saturos. Everybody makes this mistake. I've even seen it in the New York Times. But here's the thing: I'm in the middle of trying to define a measure to use as context, so that I don't have to use GDP all the time. I want to move from using GDP -- the sum of final spending -- to using a much broader measure. For my "context" variable, I want to use the sum of total spending, not the sum of final spending.

People who think GDP is a measure of total spending will never understand.

Sunday, June 29, 2014

An Inconvenient Context


GDP is a measure of final spending only. Not all spending. For example, GDP excludes things that can be taken as corporate tax deductions. Things like the "cost of goods sold". If you buy stuff in order to sell it, that is not "final" spending.

A carmaker buys tires so that the cars he sells can be driven off the lot. Maybe he buys 4000 tires and sells 1000 cars. The cost of the tires is included in the price of the cars, obviously. Let's say all 1000 cars are included in GDP. So now GDP already includes the cost of the 4000 tires the carmaker bought. So you don't want to add the separate purchase of 4000 tires to GDP, because then GDP would include 8000 tires. That would be double-counting: We know there were only 4000 tires involved. So economists say the purchase of the tires was a preliminary (they say "intermediate"; I say "preliminary") transaction, not a "final" transaction. And they do not add the preliminary purchase to GDP.

In our scenario, the manufacture and sale of those tires did happen. Yes, the value of all that work is included in GDP when the car sales are included in GDP. However, there are many transactions involved in the production and sale of the tires that are not separately added to GDP. That is because GDP is a measure of what we have produced. It is not a measure of the economic activity that was required for production.

GDP is a measure of what we have produced. It is not a measure of the economic activity that was required for production.

If you listen for it, you will often hear people say GDP is the size of our economy. You will hear them say GDP is a measure of all economic activity. The latter claim is most certainly incorrect. GDP is a measure of what we have produced. It is by no means a measure of all the economic activity required by the production process.

GDP is the cream floating on top, in a glass bottle of milk that's not homogenized... if you're old enough or bold enough ever to have seen such a thing.

Source: Udder Farm Milk Cream & Cheese Company
via FlavourCrusader
For the sake of argument, so to speak, I am throwing together data to create a number to use as a context number in place of GDP. I don't want to figure just the cream for context. I want to figure everything in the bottle.


In order to describe where I'm going, let me begin by describing where I start. I start with GDP. GDP is "final" spending. The cream on the top. It includes most or all of consumer spending, most or all of business investment spending, and most or all of government spending. (And, yes, net exports.)

Wikipedia points out that the government component does not include transfer payments, and the business investment component does not include purchases of financial products. The former (I think) are counted in GDP as part of the consumer spending component; the latter (Wikipedia says) are saving, not investment.

But let me put it the way I put it the other day:

Back in the late 1970s when I got my three credits in macro, they said GDP equals consumer spending plus business investment plus government spending plus net exports.

See it? GDP includes business investment, but not all of business spending.

Almost missed that, didn't you, in the flurry of details about transfers and financial products. If you take all of business spending and put it in two piles, the pile of business investment spending would amount to about 18% of the cream floating at the top of the milk bottle. The other pile of business spending, the pile that's not investment, completely fills the bottle below the cream.

Got it now?


I want to take final spending -- GDP, the cream on the top -- and add to it the non-final spending that represents actual economic activity, but is written off as business expenses, filling the milk bottle in the process.

I have to do this by poke-and-hope, as I've never seen it done by someone who might actually know what they're doing. I'm thinking businesses write off their non-final expenses, but they also write off (or at least they depreciate) their final expenses. So I think if I look at total business tax deductions I will get both final and non-final spending all in one number. I can live with that.

But the final part of that number is already included in GDP. If I take GDP and add total business income tax deductions (as an estimate of total business spending) then I will be double-counting final business spending. So I need to start with GDP, subtract out the business investment component, and then add total business tax deductions. And this will give me a number that represents the dollar value of the economic activity that was required for the production of GDP.

In words it sounds complicated, but the arithmetic is simple:

GDP - I + Business Income Tax Deductions

where I is the business investment component of GDP.

In order to figure the numbers for economic activity required for the production of GDP, I need the numbers for GDP. That's simple enough; I can get them from FRED. I need the numbers for business investment. For this I can use Gross Private Domestic Investment, also available from FRED. The third thing I need is the series of numbers for business income tax deductions. For this I can turn to the Historical Statistics for data through 1970.

After 1970 I can use various editions of the Statistical Abstract. If I find the right table in the Abstract I can pull out numbers for four or five consecutive years. Then I need a later edition of the Abstract so I can grab another batch of numbers. I really want a one- or two-year overlap so I can see that there is continuity in the data. I sure don't want my graphs to show data revisions that I don't know about.

Gathering these numbers is the "inconvenient" thing, in case you were wondering.

Actually, I had this all done in time for the post of 26 June. But at the last minute I noticed a problem. I was using numbers for corporate business instead of all U.S. business. Hey, you know, corporations dominate; so if I only count corps I get the dominant effect.

Yeah, but if I only count corps, I may misinterpret the growth of the corporate economy as the growth of business. I think non-corporate business faded as corporates rose, so that the growth of business spending would be less than the growth of corporate spending, and less than my first series of numbers were showing. But I'm not sure, and I can't be sure until I get a second batch of numbers completed, numbers that include proprietorships and partnerships as well as corporate businesses.

That's what I'm doing now.


Man! That takes hours.

I got numbers for 1959 thru 2008. That's decent.

Okay, here's what I got:

Graph #1: Federal Spending relative to Final Spending (blue)
Federal Spending relative to Final + NonFinal Spending (red)
I'm just gonna leave you with that. I have too much time in this already.

Saturday, June 28, 2014

Reflecting on Context


As the recent posts have been considering context when evaluating economic data, and as my Saturday morning post is not yet (Friday evening) writ, it occurs to me to "reblog" an older post on the topic:

Federal Debt Held By Federal Reserve Banks

F, D, H, B, F, R, B. It's easy to remember: Just look at the title of this post. FDHBFRB is the name of a FRED dataset.

There is another dataset too, with the same letters, plus an N at the end. N is for "new", I suppose, suggesting that the original set of capital letters represents a discontinued series. It does.

Here's what I looked at first:

Graph #1: Discontinued (blue) and New (red) Fed Holdings of Federal Debt, Relative to GDP
Fed Holdings (of Federal debt) relative to GDP. What's wrong with this picture?

Debt went up, that's what's wrong. Debt went up *way* more than GDP since the 1950s. GDP is a small denominator. GDP makes Federal Debt Held By Federal Reserve Banks look bigger than it is.

Here's a better measure:

Graph #2: Discontinued (blue) and New (red) Fed Holdings of Federal Debt, Relative to TCMDO
Fed Holdings relative to Total Credit Market Debt Owed.

By the standard of the 1950s and '60s, Fed Holdings since the 1990s should have been twice as high as they were. By that standard, Fed Holdings are low yet today. Even with that big spike there at the end.

Fed holding should be twice as high, or Total Credit Market Debt Owed should be half what it was since the 1990s. Or some combination of the two.

This is the Arthurian policy recommendation: more Fed holdings, and less credit market debt. Why? Because you can use credit for just about everything these days. But you can't use credit to pay off debt.

Federal Reserve holdings of Federal government debt is a measure of how much money the monetary authority has put into the economy. What should we compare that to? GDP? Why? Because we always compare everything to GDP? I need a better reason.

I compare those holdings to the amount of debt that the banking system has generated from that money. This is not a context at random. It is the most relevant context possible, from my point of view.

Friday, June 27, 2014

A Convenient Context


FRED Blog asks How big is the federal government? They show a graph of "Federal Government Current Expenditures" relative to GDP:

Graph #1: Federal Spending relative to GDP (from the FRED Blog 23 June 2014)
They write:

The graph shows the huge government buildup during WWII, almost doubling in 1942, and its equally impressive contraction thereafter. Since then, the size of the government has fluctuated between 17 percent and 23 percent of GDP...

Not my idea of fluctuation. For fluctuation see Graph #4 in yesterday's post.


Their question doesn't sit right with me. The question "How big is the Federal government?" is what you would ask if you were arguing that government is too big. It's a popular question. I suppose that's why FRED Blog addresses it. But it's not a good question. Myself, I'd rather try to get people asking better questions.


"One way to determine the size of the U.S. Federal government is to look at its expenditures," they write. "Of course, population and the economy have grown, so it’s a good idea to use a ratio to measure expenditures. For example, you can divide expenditures by GDP, and this is exactly what is shown here."

Reminds me. A few months back I remarked

why they always show debt relative to GDP is beyond me.

Two people, whose knowledge and thoughtfulness I respect, replied. Geerussell wrote:

I assume it's because looking at anything relative to GDP is convenient shorthand to get a sense of scale...

Jazzbumpa seconded that remark:

geerussell is right. It provides context.

I think those were knee-jerk reactions. I mean, I know it provides context. And if you think of GDP as "the size of the economy", it would seem to provide a very good context indeed.

But what if our economy is having troubles? I mean, what if economic growth has been slowing for three or four decades? Is "the size of the economy" still a good context in the face of secular stagnation? I don't think so. A slowing economy, as context, makes other things that are similarly slow appear perfectly normal. A slowing economy, as context, makes things appear to be growing that are slowing, but slowing somewhat less quickly than GDP.

One could argue it is the slowing growth of GDP that makes Federal spending appear to be growing too fast. It would be an easy argument to make.

Anyway, the FRED Blog graph uses the one data series that economists always use as a basis of comparison: GDP.

Oh ye of little imagination!

Thursday, June 26, 2014

The purchase of the pebble


Yesterday I showed that gross corporate income is just a little less than twice the size of GDP:

Graph #1: Gross income to U.S. corporations is almost twice the size of U.S. GDP.
The gap between the red and blue lines is all corporate tax deductions.
Gross corporate spending is only slightly less than gross corporate income.

Corporate spending is bigger than GDP? How can that be?? Ha! I've been waiting for the chance to tell this story.

I go for a walk one day and find a pretty pebble. I clean it up and put it in my pocket.

Later I show the pebble to my friend B. B likes it, and offers me a dollar for it. Done!

B paints a little picture on the pebble and sells it to C for $2.

C puts it in a pretty box and sells it to Big D Stores for $3.

Customer E buys it for $4 and gives it to her boyfriend.


The "final spending" in that little scenario is the $4 that Customer E pays for the pebble. It's "final" because E is the consumer of the product. All the spending that came before was "intermediate" or preliminary spending -- the $1 and the $2 and the $3. There was $6 of preliminary spending and $4 of final spending, and a total of $10 in spending.

Why is "final spending" important? Look at the income generated in the scenario: I made a dollar, and B made a dollar, and C made a dollar, and Big D made a dollar. Four dollars of income was generated by the transactions. That's the same as the four dollars of final spending, Customer E's purchase of the pebble. That's why it's important.

But there was also $6 of preliminary spending in the scenario -- half again as much as the final $4 spending. The preliminary spending is much more than the final spending. That sort of thing is similar to what happens with corporate spending: the $6 is a tax deduction, and the $4 is taxable income. The numbers are different, of course. But the concept is the same.

I hope this puts your mind at ease.


Back in the late 1970s when I got my three credits in macro, they said GDP equals consumer spending plus business investment plus government spending plus net exports.

See it? GDP includes business investment, but not all of business spending.

Back in the late 1970s, they said the business investment part of GDP is called Gross Private Domestic Investment, GPDI. I don't know why I remember that, but I do. Anyway, if you take GDP and subtract out GPDI, you've taken the business portion out of GDP.

They told us (again, I don't know why I remember this) business investment is about 17% of GDP. That was a long time ago, of course; it could have changed by now. Here's what FRED has on it:

Graph #2: Gross Private Domestic Investment as a Percent of GDP
About 17%. A little higher since the mid-1970s. Call it 18%.

Anyway, we can subtract this business investment spending out of GDP. And then we can add the total corporate deductions of U.S. corporations. Businesses get a tax deduction for pretty much all of their spending. I'm using corporate deductions as a measure of total business spending.

It's crude, I know. But I don't know a better measure.

Doing the crude thing, this is what I get:

Graph #3: GDP (red) and GDP plus the rest of Corporate Spending (blue)


Graph #4: GDP as a Percent of "GDP plus the rest of Corporate Spending"
Okay. Now we're ready. Yesterday's post and this one are just some background info I wanted to pass along before we get to tomorrow's post.

See you tomorrow.

Wednesday, June 25, 2014

Grit your teeth...

... while we work our way to the interesting stuff at the end.

Here's what I did:
1. Google U.S. business tax deductions data historical...
2. Get to irs.gov...
3. Search irs.gov for business tax deductions data historical...
4. Find Table 13...
5. Prepare to download Table 13.

The file I got was named histab13e(2).xls. You might not have the (2) in the name if you download it. I think I downloaded the thing once before, so I have (2).

The file contains corporate tax data for the years 1990-2010. Among the major categories: Number of returns, Total receipts, Total deductions, Income subject to tax, Total income tax, Tax credits, and Total income tax after credits.


I made a copy of the original page (Histab13E) and deleted a bunch of rows. Deleted most of the sub-categories, in case you don't have the appetite. I deleted none of the corporate tax credit categories, in case you want to get your blood pressure up.

Here's the zoho:


I made a copy of the file and reduced it even further, then added values for nominal GDP from FRED. Then I made a graph showing gross corporate income relative to GDP (blue), net corporate income relative to GDP (red), and corporate income tax owed (yellow):

Graph #1: Corporate Gross Income, Net Income, and Income Tax
The blue line says that gross income for U.S. corporations was almost twice the size of the U.S. GDP. Betcha didn't know that.

Oh, and the gap between the red and blue lines? That's all tax deductions.