Thursday, July 31, 2014

"How much money should the central bank print and buy things with?


As much as is necessary, to hit the NGDP target." -- Nick Rowe

Total Assets of the Federal Reserve, almost Five Times what they were before the Crisis. So far.

Wednesday, July 30, 2014

4.9 times as big as it was in August, 2008


Tuesday, July 29, 2014

Track the problem to its source


Central banks don't buy liabilities.


Steve Roth says

A a year or so back I highlighted David Beckworth’s great post on Helicopter Drops... I’ve been pinging ever since to see a response to that post from Market Monetarist opinion-leader Scott Sumner... I won’t rehash it all here but rather point you to Nick Rowe’s wonderfully successful effort to bring it all to conclusion, synthesizing Market Monetarist and New Keynesian thinking into support for a policy proposal that I think Post-Keynesians and MMTers would also jump on with gusto...

And that was pretty much it. I had to follow Steve's links to discover the topic. Started with Beckworth on helicopter drops:

Fiscal policy geared toward large government spending programs is likely to be rife with corruption, inefficient government planning, future distortionary taxes, and a ratcheting up of government intervention in the economy. So I will pass on this type of fiscal policy. Fiscal policy, however, that largely avoids these problems and directly addresses the real issue behind the aggregated demand shortfall--an excess demand for safe, money-like assets--I will endorse. And that form of fiscal policy is a helicopter drop, a government program that gives money directly to households.

Oh, says I. Giving money directly to households. Yeah, that reduces the debt-per-dollar ratio. That works. I like it.

I don't like Beckworth's reasoning -- that "the real issue behind the aggregated demand shortfall [is] an excess demand for safe, money-like assets". No. The problem did not begin with the sudden increase in demand for safe, money-like assets. The problem began when normal assets started getting "toxic". Or rather, the crisis began with toxic assets. The problem goes much farther back in time.

I went back to Steve Roth's and followed the link to "Nick Rowe’s wonderfully successful effort". Nick's post -- Oh! I read that one already. Read and commented on it I think... Yup. That's probably not good, if there is all this backstory that Steve and others have been following for "a year or so"...

Oh, well.


At WCI, Nick makes me shudder:

How much money should the central bank print and buy things with? As much as is necessary, to hit the NGDP target. And if it runs out of other things to buy, like government bonds, or commercial bonds, or......, then it should buy newly-produced things, if necessary. And if that means it is buying too much, and getting too big, then raise the NGDP target and the implied inflation rate and the implied tax on holding currency.

... If the central bank runs out of things to buy and needs to buy new bridges to hit its NGDP target, and if the government doesn't want the central bank owning bridges, the government should buy those bridges financed by issuing bonds, and let the central bank buy those bonds.

The central bank should just keep buying things, Nick says, until the path of NGDP is where we want it. Even if it has to buy bridges.

That's what I was responding to, in my comment:

No. If you have to say the central bank should buy "newly-produced things, if necessary" then I have to say you misunderstand the problem.

In the normal economy Nick would never say such a thing. Even two years ago, probably, Nick would not have said such a thing. But the central bank has been unable to solve the problem, so the human reaction function keeps turning up the pressure.

It is as if Nick knows the central bank should be able to solve the problem -- and that if it fails, the failure must be because the central bank wasn't trying hard enough. But this evaluation of central bank policy is based on the assumption that bank policy has been right all along, and we only need more of the same. I don't think that's the case.


When the central bank sells something, it takes money out of the economy and puts something else in. When it buys something, it puts money into the economy and takes something else out. When the Federal Reserve was buying up toxic assets, it was putting "safe, money-like assets" into the economy and taking the toxic assets out.

But if toxic assets seem to be the problem, then really the problem is whatever it was that made the assets toxic. You have to track the problem to its origin. You don't wait till the shit hits the fan and then say it's the stinky mess that's the problem.

Toxic assets? That was a result. You have to ask: What made the assets toxic? The assets became toxic because the liabilities became unaffordable.

When people could no longer afford to make the mortgage payments, mortgage-backed securities became toxic.

The problem is not that assets went bad. The problem is what made them go bad. Track the problem to its source. Liabilities became unsustainable; therefore, assets became toxic. Central banks bought up toxic assets, but left liabilities to fester.

The Federal Reserve's balance sheet is now almost five times its pre-crisis size, but still the problem is not solved. Nick says let them just keep buying assets until the problem is solved. But it did not work, and it will not work, and here is the reason: The problem is not in the assets. The problem is in the liabilities.

Central banks don't buy liabilities. So central bank policy has not solved the problem, and cannot solve the problem. The liabilities are still there. No matter how many assets the central bank buys, the liabilities remain.

That's why I like the "helicopter drop". It puts money into the economy. Some of that money goes directly into the hands of people who might use it to pay down their debt. That decreases liabilities and hopefully it decreases toxic liabilities. Pot luck, yes, but it's better than buying bridges.

Monday, July 28, 2014

Oz


I recall some offhand remark by Milton Friedman in either Free to Choose or Money Mischief, or possible both, about the "Oz" in "the Wizard of Oz" being a reference to an "ounce" of gold...

... Here it is, a footnote to Chapter 3 of Friedman's Money Mischief:
In a fascinating paper, Hugh Rockoff (1990) persuasively argues that Frank Baum's The Wonderful Wizard of Oz "is not only a child's tale but also a sophisticated commentary on the political and economic debates of the Populist era" (p. 739), that is, on the silver agitation generated by the so-called crime of 1873. "The land of Oz," according to Rockoff, "is the East [in which] the gold standard reigns supreme and where an ounce (Oz) of gold has almost mystical significance" (p. 745). Rockoff goes on to identify the Wicked Witch of the East with Grover Cleveland, the gold Democrat who, as President, "led the [successful] repeal of the Sherman Silver Purchase Act of 1893" (p. 746).

Similarly, Rockoff is able to identify many of the other places and characters, and much of the action, with places, people, and events that played a significant role in the final years of the free-silver movement.

I read that, probably some time during Bill Clinton's first term. But I never saw another reference to the topic till now. Having found some useful-looking stuff on regression in Excel, in relation to the Marginal Propensity to Consume, I followed a few links to Professor Combs of Fordham, and to notes on a course called The Wealth of Words: Economics and Literature:
ECRM 1160: The Wealth of Words:  Economics and Literature

Course Description:

From the writings of Austen to Zola, literature has a great deal to teach us about economic principles.  Some are obvious, such as the theme of social and economic inequality in Steinbeck’s The Grapes of Wrath; others are more veiled, such as the allegory of the Federal Reserve System and debates over monetary policy in The Wizard of Oz.  These are only two of many examples where economics and literature intersect.

This course will introduce economic ways of thinking to students interested in the study of literature while opening the literary world to students interested in economics and business.  The course content uses selections of poetry, short stories, songs, plays, literary essays, films, and chapters of novels to demonstrate core economic principles and concepts.  Some examples of topics and titles include the ideology of capitalism (Forster’s Howard’s End); the anti-capitalist sentiment (Lewis’ Babbitt); the non-market economy (Erdrich’s “Francine’s Room”); poverty and income inequality (Wright’s Native Son); monetary policy (Baum’s The Wizard of Oz); urban industrial development (Sandburg’s “Chicago”); opportunity cost (Yeats’ “The Choice”), and social and economic (in)justice (Brooks’ “The Lovers of the Poor”).  The fourth hour will be used to view films, workshop student essays, and visit relevant New York City sites of interest, such as the Lower East Side Tenement Museum, Ellis Island, and the Federal Reserve Bank of New York.

So there ya go.

Sunday, July 27, 2014

Roots of the Gold Standard


The Schoolmen: "Certain theologians of the Middle Ages; so called because they lectured in the cloisters or cathedral schools founded by Charlemagne and his immediate successors."
St. Thomas: 1225 – 1274
Buridan: (c. 1300 – after 1358)


Excerpts from Monetary Theory before Adam Smith, by Arthur Eli Monroe, Ph.D., Assistant Professor of Economics, Harvard University. (The book is (c) 1923 by Harvard University Press)
St. Thomas not only repeated what the Greek philosopher [Aristotle] had said about making money of materials useful in themselves, but added that the high specific value of the precious metals, making them easily portable, was a further reason for their use as money.

To this somewhat tentative analysis Buridan made important additions. Money should be made of precious material, he says, in order to facilitate transportation; durable, in order to serve as a store of value; divisible into small parts for lesser purchases; and capable of being impressed with adequate marks for identification.

...the statement of Buridan may be said to have remained the accepted one for over a century, and the basis of all later discussion.

Saturday, July 26, 2014

The whole of Chapter One


Here it is, the whole chapter, sans footnote, from the Marxists:
I HAVE called this book the General Theory of Employment, Interest and Money, placing the emphasis on the prefix general. The object of such a title is to contrast the character of my arguments and conclusions with those of the classical theory of the subject, upon which I was brought up and which dominates the economic thought, both practical and theoretical, of the governing and academic classes of this generation, as it has for a hundred years past. I shall argue that the postulates of the classical theory are applicable to a special case only and not to the general case, the situation which it assumes being a limiting point of the possible positions of equilibrium. Moreover, the characteristics of the special case assumed by the classical theory happen not to be those of the economic society which we actually live, with the result that its teaching is misleading and disastrous if we attempt to apply it to the facts of experience.

Short and to the point. And it comes first. It's the first chapter in the book. I think that means something. I think that means Keynes thought it important.

Not insignificant because the chapter is short, but clear because the chapter is short, and important because it comes first. What was it Cochrane said?

A good joke or a mystery novel has a long windup to the final punchline. Don’t write papers like that — put the punchline right up front and then slowly explain the joke.

That's what Keynes did: He put the most important thing first.

When I came upon Chapter One just now, what struck me was its brevity. But what I remembered then was the long back-and-forth between Peter L and Philip Pilkington at Pilkington:About. I am thinking in particular of this from Peter L:
We’re discussing what is an extremely minor point (and I am squarely to blame here!). But here’s one last go at clarification:

1. I noticed you say that the reason why the GT is called “general” is because Keynes saw it as applying to all economies regardless of institutional framework and political system.

On this I think there is no room for misunderstanding we agree that you said this and we agree on what you meant by it. We also agree Keynes was attempting a theory of economic behaviour so of course, mutatis mutandis, if that theory is correct in one set of institutional circumstances, it would fit all.

2. Ok next you cite the German preface of GT in support of your contention in 1 above.

3. My argument is that while Keynes may well have seen his theory as being applicable not only to economies with democratic institutions, that was most definitely not his REASON for using the term “general”.

Unless I’ve missed something (altogether possible of course!) I see no scope for misunderstanding.

While I would contend the German preface is not a place to find Keynes’ theory, I do think what he says on page three is definitive, and I’m sure you know this passage well. (My added emphases).

“I have called this book the General Theory of Employment, Interest and Money, placing the emphasis on the prefix GENERAL. The object of such a title is to CONTRAST the character of my arguments and conclusions with those of the CLASSICAL theory of the subject, upon which I was brought up and which dominates the economic thought, both practical and theoretical, of the governing and academic classes of this generation, as it has for a hundred years past. I shall argue that the postulates of the classical theory are applicable to a SPECIAL case only and NOT to the GENERAL case, the situation which IT ASSUMES being a limiting point of the possible positions of equilibrium. Moreover, the characteristics of the SPECIAL case assumed by the classical theory happen not to be those of the economic society in which we actually live, with the result that its teaching is misleading and disastrous if we attempt to apply it to the facts of experience.”

Finally it is surely the case that Keynes really did not think of Marshall et al were simply writing about the Victorian British economy whilst the “general” theory would apply to the Victorian British economy as well as the German totalitarian economy and indeed any others.

His point is that the classical theory applies to NO economy (except in SPECIAL circumstances).

Yes, I made you read the whole of Chapter One twice now. Forgive me. But it's an important paragraph. It's important not to misunderstand it. I think Peter L has it exactly right, emphases and all.

Maynard was telling us that the economy is much bigger than we think, bigger and more of a whole. Economists today argue whether something somebody said a hundred or a hundred and fifty years ago is right or wrong. All else aside, isn't that pathetic? Everybody is wrong sometimes, but most people try to get it right. Any economist who is worth anything tries to get it right. So, taking the best of what someone offers, that part of what they say is probably correct, or close.

So why is it we take these things people said back when, when the economy was different than it is now, why is it we take these things and just call them wrong and reject them? Are we not being most disrespectful? Are we not missing the bigger picture? Are we not dismissing something brief, clear, and important enough to make it into the first chapter of The General Theory?


In Thoughts on Brad’s Thoughts on Economic Theology, Robert Waldmann quotes Joseph Stiglitz (via Brad DeLong):

a peculiar doctrine came to be accepted, the so-called “neoclassical synthesis.” It argued that once markets were restored to full employment, neoclassical principles would apply. The economy would be efficient. We should be clear: this was not a theorem but a religious belief. The idea was always suspect…

Waldmann adds: "Brad notes that the peculiar doctrine is due to Keynes".

DeLong offers a different quote, but that "particular doctrine" is the one Keynes established in the first chapter, which by now you've read at least twice. Stiglitz rejects it. DeLong says "it is not true in practice". And Waldmann rejects it also, saying "I don’t think that, even given full employment, markets are efficient."

I say markets were efficient at the time economists observed efficient markets -- the time of Say and Ricardo and Smith. Today, no -- but that's a different matter.

Here's the thing: Stiglitz and Delong and Waldmann flat-out reject the notion that markets can be efficient even when the "special case" holds true. I think the "special case" is a unique time, a peak in the Cycle of Civilization.

Now really: which view is more interesting?

Friday, July 25, 2014

But it's Yglesias...


Big chains pay better than mom and pop stores, says the title of the post. But it's a story by Matthew Yglesias, so I already have my doubts. He writes:

High school graduates who work for companies with over 1,000 employees earn 15 percent more than similarly educated workers who are employed by smaller firms. Workers with at least a little college education see a bigger pay boost and earn 25 percent more when employed by big companies.

Similarly, for retail establishments:

The researchers find that not only do big companies pay higher wages, but big stores pay higher wages. High school graduates working at retail establishments with over 500 workers earn 26 percent more than similarly educated workers at smaller shops. Those with at least some college education, again, earn an even larger premium — 36 percent more at big stores than small ones.

I wonder how those numbers would look if "business size" was based on volume of sales rather than number of employees. How would it look if we compared worker pay to gross business income?

I want to see ratios of dollar-values-to-dollar-values, rather than dollar-values-to-head-counts. I don't think the bigger, the better would hold up so well if you did the dollars-to-dollars comparison.

Thursday, July 24, 2014

Denominator Problems


At Economist's View, from James Choi: 'One of the Most Vivid Arithmetic Failings Displayed by Americans'

If you've gone postal lately...


... tell us about your recent postal experience:


Descartes


...thanks be to God, I did not find myself in a condition which obliged me to make a merchandise of science for the improvement of my fortune.
From Descartes: Selections edited by Ralph M. Eaton. The Modern Student's Library, Philosophy Series. Charles Scribner's Sons, New York, 1927. Page 8.

Wednesday, July 23, 2014

Focus


Smith was not the first nor the only 18th-century, political economist. He wrote just before what we call the ‘Industrial Revolution’. His focus was on history, not the future (he did not make predictions for the future; he tried to understand the past as a guide to the present).
- Gavin Kennedy on Adam Smith

What's wrong with economic theory today?


One of the first of the considerations that occurred to me was that there is very often less perfection in works composed of several portions, and carried out by the hands of various masters, than in those on which one individual alone has worked.
- Descartes

Tuesday, July 22, 2014

"But they haven't learned how to theorize."


Frances Woolley at WCI:

They can follow the most complicated plans, and build any model they are asked to build. But they struggle to come with an idea of their own; to decide what they want to build. Nothing in their training has encouraged them to fill their minds with ideas, nor taught them to distinguish the awesome from the not-so-awesome.

Sunday, July 20, 2014

New and Different


I want to make it clear that I am talking about a new and different policy.

We have a new and different chairman at the Federal Reserve: Janet Yellen. But having a new and different chairman does not necessarily mean new and different policy.

From Brookings: Fed Unveils a New Job-Market Index by David Wessel:

In her testimony to Congress this week, Ms. Yellen said that “significant slack remains in the labor markets” and noted that wages are rising very slowly, all of which points to an economy which has not yet fully recovered from the Great Recession and still needs the sustenance of low interest rates.

Most people might evaluate Yellen's remark by focusing on whether or not "significant slack remains". Everyone is wagging the same tongue: The economy is recovering -- or it is not. It is time to raise interest rates -- or it is not. Inflation is just around the corner -- or it is not. Endless prattle, tiresome and nonproductive.

Open your mind.

This is not the thing: We have one policy that lowers interest rates to boost economic growth, and another policy that raises interest rates to fight inflation. That's not it.

This is it: We have a policy that raises or lowers interest rates, depending on whether we are more concerned about inflation or growth. It is one policy: We change interest rates. It is only one policy, with two phases you might say.

So if we toss aside one Fed Chairman and install another, hoping to see (or not to see) a change in the path of interest rates, this is not a change.

It would be a change if we were to abandon our policy of raising-and-lowering interest rates, and adopt some other policy or combination of policies in its place. That would be a change.

That would be new and different.


Thus the remedy for the boom is not a higher rate of interest but a lower rate of interest! For that may enable the so-called boom to last. The right remedy for the trade cycle is not to be found in abolishing booms and thus keeping us permanently in a semi-slump; but in abolishing slumps and thus keeping us permanently in a quasi-boom.

David Wessel says Janet Yellen says that the economy "still needs the sustenance of low interest rates."

No, not "still needs". The economy always needs the sustenance of low interest rates. But this means we cannot raise interest rates as a policy tool to fight inflation. And that means we need a different policy tool to fight inflation.

See? This is what I mean by new and different. It isn't new and different if we push interest rates up instead of down. It isn't new and different if we hold interest rates down instead of letting them up.

It's not different if we exhale instead of inhale. It would be different if we suddenly got gills, or if we started absorbing oxygen through the skin and didn't need lungs anymore. That would be different.

We have to keep interest rates on the low side, always, so that the economy can grow. If you do not reject this idea immediately, you can think about it and you must say: But if interest rates remain low, there will be too much borrowing-and-spending, and we will get inflation.

You are right. So let us examine the problem that arises if we keep interest rates low: We get too much borrowing. The increased borrowing leads to increased spending. And the increased spending leads to inflation. Okay! That wasn't nearly as painful as I thought. Now...

If we keep interest rates low and remain permanently in a quasi-boom, we get increased borrowing and increased spending. We get increasing debt and increasing prices. This is undeniable. It happened in the 1960s and '70s.

And yet, did you notice in the years after 2008, there was a great deleveraging: debt stopped increasing and the money supply stopped growing. The Fed responded with bizarre emergency measures, boosting the quantity of money to avoid deflation.

People focused on paying down debt, and the threat of inflation disappeared. Did you notice? Paying down debt is a way to fight inflation.

Suppose we keep interest rates low, and as a result we see an increase in borrowing and the growth of debt. We see an increase in spending, and rising prices. But if we can only find a way to encourage a more rapid paydown of debt, we can have the increase in borrowing without seeing the growth of debt. We can get the economic vigor that comes from new borrowing without having to face the "significant slack" that arises from an excessive burden of debt.

And, if we find a way to encourage more rapid paydown of debt, the paydown of debt will drain money from the spending stream, limit the increase of spending, and limit inflation. If we can only find a way to encourage a more rapid paydown of debt.

Child's play. All we have to do is start weeding out the policies that encourage use of credit and accumulation of debt, and replace them with policies designed to accelerate the repayment of debt.

This is what I mean by new and different policy: Not interest rates that run high and low like the tides. Rather, a commitment to low rates and strong growth, permanently, and commitment to a tax policy that fights inflation by accelerating the repayment of debt and by preventing the excessive accumulation of private debt. Permanently.

This is what I mean by new and different.

//

More: An Arthurian Future ... Geanakoplos and the Can of Worms ... Sumner engages the crystal ball ...

Saturday, July 19, 2014

Penn World Tables


The "Notes" tab of FRED's Total Factor Productivity page has a "For more information" link to the research tab at Penn World Table (PWT).

The PWT page offers several tables, including a "Data" table. That table lists several measures of real GDP, but also DA and GA -- Development Accounting and Growth Accounting.

DA provides "the sources of differences in living standards at a point in time". That sounds interesting. The words "living standards" capture one's attention.

GA, Growth Accounting, provides "the sources of economic growth over time". Not too long ago I looked a bit at the Solow Growth Model. It's something I want to look at again. I clicked this one. Here's a piece of what I got:


Data goes back to 1950, that's decent. Several countries, okay. Capital stock values, yeah that's related to the Solow Growth Model, okay.

If they're so blunt as to present that particular set of nations (instead of maybe the G7 nations) they have to be bold enough to make it easy to change what shows up on the list. Yup: See that red dot in the upper left, just above the table? "Adjust criteria". You got it. There's a lot of countries to pick from, and more, and it's pretty intuitive. And the "adjust criteria" page has a red dot in the upper right, pointing right, that gets you back to the data table. Very nice.

Something I never saw on line before: In the table, in the header area, at the left, it says "Toggle display". I didn't try that one yet. But to the right of it there are four little arrows. Hover over the down-arrow and a tag says "Change order". Hover over the diagonal arrow and the tag says "Move to Y-axis". That, I never saw on line before.

I didn't play with the buttons. I adjusted the criteria to show only U.S. data. Because I'm focused. Or myopic, whatever. The previous table shows "Capital stock at constant 2005 national prices" for half a dozen countries. The following table shows "Capital stock" and four other "growth accounting"-related data categories:


If you need to see it bigger click the image, or just go to Penn World Tables.

I like the place already.

Friday, July 18, 2014

"They're five cents lower per pound on welding wire"


You know you have to compare prices to get the best deal.

You also know that the big companies can give you lower prices than the little companies. It's buying in bulk, or economies of scale, or some such thing.

But let me ask you this: Do you think it's right that the government should help the big companies more than it helps little ones? Help Walmart drive Mom-n-Pop out of business? Is that right? Certainly not.

And yet we have a business income tax system that lets you write off all your expenses. Gives you a tax break for all your expenses. So if you're Mom-n-Pop, with business expenses of a hundred thousand a year, you avoid paying taxes on $100,000. If you're one of the big guys, with business expenses of several billion dollars a year, you avoid taxes on several billion dollars, because of our tax system.

Our tax system favors bigness. And then we moan about "too big to fail".

BTW: The total amount of business income tax deductions is approximately twice the size of GDP.

Thursday, July 17, 2014

Scatterplotting Debt


At the FRED Blog, Debt- and deficit-to-GDP dynamics. Three scatter plots of government debt versus government deficit since 2001. Graphs for the U.S., Japan, and the Euro Area. I will only look at U.S. data.

The opening sentence of the FRED Blog post:

Several historical examples show that financial crises generate large increases in private and public debt that take many years and sometimes drastic measures to resolve.

Sadly... ironically... typically, they speak of "private and public debt" but they only look at public debt. That's okay. I'll fill in the blank.

Here's the first graph from the FRED Blog post:

Graph #1: Federal Debt (vertical scale) versus Federal Deficit (horizontal scale) 2001-2013
The uppermost red dot represents 2013. If you count years backwards from that dot, following the red line, you see that the leftmost dot represents 2009, and that the dot before that, 2008, is far removed from the 2009 dot and clustered with the dots from before 2008.

(If you know that the Federal debt for 2013 was the highest since World War Two, you can tell that the highest dot on the graph is the 2013 dot. And if you know that 2009 had the big increase in Federal deficits, and that the deficits have been getting smaller since, you can tell that the leftmost point is the 2009 dot. I didn't remember those things, so I had to look around some.)

I followed the blog's "customize" link to the FRED source page and pushed the start-date back to 1970. So we can see all the dots on the first graph, and more:

Graph #2: Federal Debt (vertical scale) versus Federal Deficit (horizontal scale) 1970-2013

Easier to see now: The 2008 dot is the last in a cluster. For some reason the color setting changed when I changed the start-year. I couldn't duplicate their setting.

What this graph shows is that, before 2009, the Federal deficits ranged between zero and six percent of GDP. It also shows the budget surplus of the Clinton years. Looks like four years in surplus, with a maximum surplus of just over 2% of GDP.

During that time, 1970 to 2008, the Federal debt ranged from 30 to about 65% of GDP: never over 70%, but tending to increase rather than decrease. The big, massive jump from 2008 to the leftmost dot, 2009, pushed debt up over 80% of GDP. A slowing economy (I mean, slowing GDP growth) also helped push the dots higher.


Since the FRED Blog failed to do it, I thought I'd look at Federal debt versus non-Federal debt:

Graph #3: Federal Debt (horizontal) versus Non-Federal Debt (vertical) 1949-2013
The last dot on the right represents 2013. Counting backwards, you can see the line runs flat back to 2008: no up-and-down movement -- no change in non-Federal debt -- and large rightward steps  showing big increase in the Federal debt.

Before 2008 there is a general upward trend. The dots climb with regularity from the start. Then there is a sweep around to the right and back to the left. Suddenly, then, it turns a "corner" and climbs with regularity again toward 2008.

Counting backwards from the rightmost dot again, 2013, it turns out that the dot at the "corner" represents 2001. The leftward sweep for the few years before 2001, just below it on the graph, show the latter Clinton years when the Federal budget was coming briefly into balance.


On Graph #3 the horizontal scale (which shows the size of Federal debt) runs from zero to something over 10000. The vertical scale (which shows the size of non-Federal debt) runs much higher, up to 50,000. But here's the thing. On the vertical scale the distance from zero to 10,000 is about half an inch, maybe less. On the horizontal scale the distance from zero to 10,000 is about 3 inches, maybe more. The two scales are quite different.

I re-sized the graph to make 10,000 vertical about the same size as 10,000 horizontal. This should give you a better feel for the relative sizes of Federal and non-Federal debt. Horizontal distances measure Federal debt. Verticals measure everyone else's debt:

Graph #4: Federal (horizontal) v NonFederal (vertical) Debt, Similar Scaling
You don't even believe it, do ya.

Wednesday, July 16, 2014

GDS vs GDP: Crude, but you get the idea


The snowplow hit our mailbox last winter. Broke the post. I went out and got a 2x4 and made a new mailbox post. The work was easier than I expected.


The other day I was looking for something in the garage. I found a 3-foot length of 2x4 left over from the mailbox repair. I kept it because... because you never know.


It occurs to me that the 2x4 I bought is a model of Gross Domestic Spending. The part of the 2x4 I used to make the post, well, that's the output, that's GDP, final spending. And the 3-foot difference, that's sort of like non-final spending.


If I had a customer that paid me for the mailbox job, my little metaphor would be more accurate. But as it is, I was the final customer. Mine was the final spending. My work was for my own satisfaction (according to the IRS) so I got no tax deductions for my spending. And my 3-foot leftover piece is just post-consumption detritus. Guess I could pay somebody to haul it to the dump, and that would add a little more to GDP.

What seems to bother most people about GDP is that it doesn't measure happiness. I think that's weird. What bothers me about GDP is that it ignores trillions of dollars of spending just because we get to subtract those trillions from our taxable income. So I invented Gross Domestic Spending (GDS).

Tuesday, July 15, 2014

Analogy

From Friday's notes:

Drove past a construction site on my way to work this morning. Yesterday there were "one lane" signs up. Today all the heavy equipment is off the road, in the clearing they made yesterday. Looks like they will be reconstructing the culvert that lets water flow under the road at that point.

The culvert, the concrete work, the clearing of land, the redirection of water flow -- this is infrastructure I suppose. But think of it as the "institutions" we create to shape and form out economy.

The one thing our institutions cannot change is the fact that water seeks its own level. We cannot change the most important thing about our economy.

Monday, July 14, 2014

"Finally we'd give up on the ideas that worked in the 1960s -- most of them, but not the idea that we always want debt to grow a little faster than the quantity of money, because we always want that."


From yesterday's 4AM post:

What's that you said? They wouldn't do that? You mean, they would never say we always want debt to grow a little faster than the quantity of money? Is that what you think?

Graph #1: Dollars of Debt per Dollar of Base Money

In 1950 there was $12.90 of debt for every dollar of base money. In 1970, $24.3. A peak came in 1990 at $47 debt per dollar of money. This was exponential increase.

The ratio fell from the peak, reaching a low of $39.8 in 1994. Then increase resumed. The ratio reached $60.9 in 2008: More than $60 of debt per dollar of base money.

If the interest rate was 2%, we were paying $1.20 interest for every $1 of base.

After 2008, crisis brought the number down. But it was the crisis that brought the number down. It wasn't policy that did it. This is how you know policy was in error.

We always want debt to grow a little faster than the quantity of money. That's the problem. Other than the last few years, the only place on the graph that we see the ratio fall is from 1990 to 1994.

And after that fall in the ratio, the economy was actually good for a few years.

Sunday, July 13, 2014

"... soon or late, it is ideas, not vested interests, which are dangerous for good or evil"


I am sure that the power of vested interests is vastly exaggerated compared with the gradual encroachment of ideas. Not, indeed, immediately, but after a certain interval; for in the field of economic and political philosophy there are not many who are influenced by new theories after they are twenty-five or thirty years of age, so that the ideas which civil servants and politicians and even agitators apply to current events are not likely to be the newest. But, soon or late, it is ideas, not vested interests, which are dangerous for good or evil.
- J.M. Keynes, TGT, Chapter 24

The power of ideas. You would think so, wouldn't you?

Reading over this morning's post, I thought: The one person who needs to read this is Representative Hensarling of Texas. Figured I'd send a link. I don't expect him to read it, but maybe an underling. Maybe, by chance, my idea would click with somebody who could present it to Hensarling in a way that makes sense to him. What the hell.

It was easy to find Hensarling on the internet. I clicked CONTACT and got the "Step One" page:

"I am unable to reply to any email from constituents outside of the district"
First time I read it, I read as far as Regrettably, I am unable... and said dammit and gave up. But I went back to the Step One page a few minutes later, because I really think he needs to consider my idea. I read a little more this time:

I am unable to reply to any email from constituents outside of the district.

Oh! I can live with that. I don't want a reply from the guy. I want to share an idea with his idea people, that's all. No problem.

Ho, hum. I dutifully filled in my five-digit zip code, then looked around till I found my "+4 extension" and entered that, too. Then I clicked Go To Next Step. Gee, they make it so simple!

Here's what I got next:

"I am only able to accept messages from residents of the 5th District."
Soon or late, it is ideas that matter. I guess. But not today.

"a published formula"


From The New York Times:
House Republicans Resume Efforts to Reduce Fed’s Power
By BINYAMIN APPELBAUM, JULY 10, 2014

WASHINGTON — House Republicans frustrated by the Federal Reserve’s expansive economic stimulus campaign and its growing role as a financial regulator are renewing their efforts to constrain the central bank.

The Fed would be required to set monetary policy based on a published formula under legislation introduced this week by leading Republicans on the Financial Services Committee. Other bills would eliminate the Fed’s responsibility to maximize employment, or eliminate the Fed entirely.

The bills face uncertain prospects in the House, and have no future in the Senate while it remains under Democratic control. But they highlight ideas that Republicans are likely to revisit if they win a majority in both houses of Congress in the midterm elections.

“We have seen a radical departure from the historic norms of monetary policy conduct,” Representative Jeb Hensarling of Texas, who is chairman of the Financial Services Committee, said at a hearing on Thursday. “Monetary policy is at its best in maintaining stable, healthy economic growth when it follows a clear, predictable rule or path.”


It's easy to draw a triangle with all sides equal:


And it is easy to draw a triangle with one square corner:


But it is impossible to draw one triangle that has all sides equal and one square corner:


We want to take the top corner of the all-sides-equal triangle (circled) and slide it over to the left (upper red arrow) to make one square corner. When we do that, the one side of the triangle slowly rotates to the left (lower red arrow) and the other side of the triangle stretches out and gets longer (dashed line). But as soon as that side starts to stretch out, the triangle is no longer all-sides-equal, and we have failed at our task!

This sort of thing is obvious to someone like me, who makes AutoCAD drawings eight hours a day. In AutoCAD you can literally grab that corner of the triangle and move it, and you can see what happens when you do.

So if the boss comes to us and says I want an equilateral right triangle, well, it just can't be done.

The boss probably wouldn't come to us with that request. But he does come to us with equally impossible requests. Usually he'll tell us the features he wants in the drawing. And when we draw it, sometimes there is a combination of features that simply cannot be done. I think it's because he's looking at the big picture and not the little details. That's okay. That's my job, the little details.

But if I tell the boss it can't be done -- and if I'm right, of course -- then it can't be done, whether he understands the reason or not. If he gets red in the face and tells me Just slide that top corner over to the left until the bottom corner is square I can do it -- because he's no longer telling me to keep all sides equal. His required combination of features has changed. But he's red in the face, and he doesn't want to hear my story.


To me, the economy is like the triangles. There are some things that just cannot be done. There are other things that can be done. But the boss -- Congress -- is red in the face and doesn't want to hear it. Just make interest rates obey the Taylor Rule he says. Just slide that top point over to the left. Don't worry about keeping all sides equal.


"Monetary policy is at its best in maintaining stable, healthy economic growth," according to Representative Hensarling, "when it follows a clear, predictable rule or path."

Well yeah, that could work. But it won't work if it's the wrong rule or the wrong path. Suppose the rule is we always want debt to grow a little faster than the quantity of money. Think that rule would work? It would work for a while, I guess, like in the 1960s; then it would start to fail, like in the 1970s. Finally we'd give up on the ideas that worked in the 1960s -- most of them, but not the idea that we always want debt to grow a little faster than the quantity of money, because we always want that. And the changes would change things -- we discover thirty years later -- when deleveraging becomes suddenly fashionable.

What's that you said? They wouldn't do that? You mean, they would never say we always want debt to grow a little faster than the quantity of money? Is that what you think? I think you're wrong:

Graph #1: Debt (blue) and Money (green) compared to GDP (red)
They always want debt to grow a little faster than money.

Oh -- see the green line? On the right there. The last half inch of it, or less, where it's no longer flat and so close to zero that it is almost invisible: See it? There around 2009, where it starts to go up. You've seen that before. Everybody showed it to you. By itself, it looks like this:

Graph #2: Base Money (green), the same as on Graph #1
Everybody showed you this graph and expected you to be shocked and dismayed.

It is troubling, I admit. But the increase that looks so troubling on Graph #2 is really next to nothing compared to the growth of debt, as you can see on Graph #1.

It was the growth of debt for half a century and more that was the real problem -- the growth of debt at a more rapid pace than the growth of money, for half a century and more. The shocking and dismaying increase in money we see on Graph #2 was the response to the long period of excessive debt growth: the response to the problem created by the growth of debt.

The increase in money visible on Graph #2 was the response. If you don't believe me, go ask Ben Bernanke.


It is Graph #2 that bothers Representative Hensarling of Texas. He wants the Federal Reserve to follow "a clear, predictable rule or path" and to keep monetary policy on the straight-and-narrow. Hensarling doesn't want the Fed making the quantity-of-money side of the triangle suddenly long. He wants to keep it good and short. He's not happy with the increase in the green line visible on Graph #2.

That's fine. But by itself, his plan won't work. To make it work you have to make sure that the quantity-of-debt side of the triangle also stays good and short. Really, this is just a broadening of the "clear, predictable rule or path" that Hensarling wants.

So there it is, in writing, the Arthurian formula.

Saturday, July 12, 2014

"Unemployment is primarily a problem of macroeconomics"


John Quiggin:

If search models aren’t the right way to think about unemployment, what is the right way? The simple answer is that unemployment is primarily a problem of macroeconomics not of labor markets. If aggregate demand is far below the productive capacity of the economy, workers will be unemployed and capital will be idle.

Reminds me of something JW Mason said:

As soon as you begin to think about employment in terms of an input of labor to a production process, you've taken a wrong turn. We should not try to give supply-based explanations of unemployment, i.e. to show how the allocation of some stock of productive resources by some decision makers could generate unemployment. Unemployment is strictly a phenomenon of aggregate demand...

Unemployment rises when planned money expenditure falls for a given expected money income. Unemployment falls when planned money expenditure rises for a given expected money income. Conditions of production have no (direct) effect one way or the other.

So when we see people unemployed, we should never ask, why does the production of society’s desired outputs no longer require their labor input? That is a nonsense question that will lead nowhere but confusion. Instead we should ask, why has there been a fall in planned expenditure?

I would have missed it, had it not been pointed out twice. But Quiggin and Mason stand apart from the thinking that produces headlines like Drop in U.S. jobless claims points to healing in labor market at Reuters.

Friday, July 11, 2014

A realist, not a fanatic


From When ignorance is power at Stumbling and Mumbling:

It's quite possible that, for some (many) businesses, law-breaking has a positive expected value: the expected benefits of fraud or phone-hacking exceed the expected costs. A profit-maximizing company should therefore undertake them. One way for it to do so is for managers to turn a blind eye so they can maintain plausible deniability, and ensure that if the wrongdoing is exposed that there's no smoking gun to connect them to the crime.

Thursday, July 10, 2014

Bad argument drives good argument out of circulation


At Reddit recently I came across The Great American Economic Growth Myth by Lance Roberts at Streettalk Live. It's a very professional-looking site, "brought to you by STA Wealth Management" the logo says, with links to the Lance Roberts Radio Show. The site even offers "Website Help!"

The growth myth post has lots of good looking graphs, and I couldn't wait to read what Lance Roberts had to say. I was okay with it until I got to this part:
From 1950-1980 nominal GDP grew at an annualized rate of 7.55%. This was accomplished with a total credit market debt to GDP ratio of less 150%. The CRITICAL factor to note is that economic growth was trending higher during this span going from roughly 5% to a peak of nearly 15%. There was a couple of reasons for this. First, lower levels of debt allowed for personal savings to remain robust which fueled productive investment in the economy. Secondly, the economy was focused primarily in production and manufacturing which has a high multiplier effect on the economy. This feat of growth also occurred in the face of steadily rising interest rates which peaked with economic expansion in 1980.


However, beginning in 1980 the shift of the economic makeup from a manufacturing and production based economy to a service and finance economy, where there is a low economic multiplier, is partially responsible for this transformation. The decline in economic output was further exacerbated by increased productivity through technological advances and outsourcing of manufacturing which plagued the economy with steadily decreasing wages. Unlike the steadily growing economic environment prior to 1980; the post 1980 economy has experienced by a steady decline. Therefore, a statement that the economy has had an average growth of X% since 1980 is grossly misleading. The trend of the growth is far more important, and telling, than the average growth rate over time.
Inflation??

Not a word about inflation. Hey, I'm sympathetic to what this guy is saying. "Lower levels of debt" is definitely the key to getting better growth. The focus on production rather than finance is central. And Lance's last three sentences --

Unlike the steadily growing economic environment prior to 1980; the post 1980 economy has experienced by a steady decline. Therefore, a statement that the economy has had an average growth of X% since 1980 is grossly misleading. The trend of the growth is far more important, and telling, than the average growth rate over time.

-- contain an element of wisdom that I tried to capture and use in mine of 5 July:

... when you say "average" it suggests up-and-down variation, but it also implies stability in the value. If intermediate consumption is trending upward as a share of gross output, it is deceptive to speak of its average value.

When I was writing mine, I didn't even realize where the idea came from. That's a nice bit of writing, Lance Roberts. I owe ya one.

But I'm surprised that I got that far reading the article. The paragraph before the graph is simply horrendous. Here, read it again:

From 1950-1980 nominal GDP grew at an annualized rate of 7.55%. This was accomplished with a total credit market debt to GDP ratio of less 150%. The CRITICAL factor to note is that economic growth was trending higher during this span going from roughly 5% to a peak of nearly 15%. There was a couple of reasons for this...

As soon as you read about economic growth reaching almost 15% sometime before 1980, you have to think of inflation. You absolutely have to. But inflation is not noted among the "couple of reasons" Roberts presents in that paragraph. Nor is it noted in the paragraph that follows the graph.

In fact, there is only one occurrence of the word inflation in the whole article:

The economy currently requires $2.75 of debt to create $1 of real (inflation adjusted) economic growth.

There is no reference to inflation's contribution to the growth numbers anywhere in the article. Personally, I think this outrageous. After reading the Streettalk Live article I went back to Reddit to get other readers' reactions. Only one other reader shared my concern. Cassander wrote:

That would be an amazing headline chart, except for the fact that it is a nominal GDP growth graph that peaks at the height of the 70s inflationary period, thus rendering it completely deceptive.

I picked up on that, and replied:

I love graphs and I approached the linked article with great anticipation. But WOW was I disappointed!
The "The Decline of Economic Prosperity" graph displays the effects of the Great Inflation, and considers it great growth. The article doesn't even mention inflation in relation to that graph. The article depends on the reader's ignorance to make its argument.

I went on to express similar disappointment with other graphs in the article. Cassander got back to me:

It's depressing, really. The charts really are extremely well done, they even have nice, nonstandard coloring. Someone clearly went to a lot of effort, but they're all complete nonsense.

I couldn't agree more.


I recreated the Nominal GDP YoY % Growth that Roberts shows in his graph. And so you could see the difference, I added inflation-adjusted GDP, in red.

Graph #4: Rates of Growth of inflating (blue) GDP and inflation-adjusted (red) GDP
On Lance's graph, before 1980, we see a trend of increasingly higher peaks as time goes by. My graph shows that, too, in blue. But if you look at the red peaks, growth with inflation stripped away, the trend is clearly down. Real economic growth was getting slower before 1980, not faster.


We definitely put too much emphasis on finance in this economy. Lance Roberts is right about that. And we definitely have too much private debt in this economy, so much that it hinders growth. And, yes, the inflation that Roberts fails to point out did help to keep debt levels low until around 1980. But the growth that he attributes to all those things that I agree with, the growth he points to explicitly -- "nearly 15%" annual growth -- must be attributed to inflation.

It pains me to say it, because I agree with so much of what he says.

Wednesday, July 9, 2014

"Turn off your television sets" and turn on your speakers


Tuesday, July 8, 2014

Finding Philippon's FinEff.pdf


I found it, sort of. Here.

Better than nothing.

Here's Figure 1:


//

Here it is, as a PDF, from SSRN. Free. Thanks, guys.

Now I have to go and backfill a few of my posts with a new copy of the Figure 1 graph. (When I wrote those posts I trusted, foolishly, that Phillippon's paper would always be available at Stern where I first found it. It ain't.

//

ps, at SSRN the pdf filename is SSRN-id1972808

//

Edit, 18 May 2017.

But maybe the graph I want is Philippon's Figure 7 from that PDF:

Graph #2, from Has the U.S. Finance Industry Become Less Efficient?

Gross Domestic Spending: Documentation


This post provides links to two Excel files and eleven short PDFs. The "GDS Data Series" file is outputs, the result of my industry. The "Business Population" file is inputs, the source data that I used.

The GDS Data Series.xls file is an Excel file generated by OpenOffice Calc. The file contains one sheet. The first two columns of the sheet contain the year and GDS values. Columns farther to the right document the calculations used to come up with the numbers.

The Business Population.xls spreadsheet is an Excel file generated by OpenOffice Calc. The file contains two sheets. The Data Entry sheet lists the source files and data values obtained from them. Columns further to the right are notes on units and on the column headers, which evolved a bit over the years.

Note that there is some duplication of data on this sheet, as I was comparing the values provided by newer and older sources at the overlaps. This duplication is eliminated from the other sheet in the file.

The other sheet in this file is named ArtS Data Series. This sheet lists the source file, the year, and "Number", "Receipts" and "Net Profit" for total business enterprises -- that is, for sole proprietorships, partnerships, and corporations, combined -- for 1959 through 2008.

In order to document the source data for the GDS series, I extracted individual pages from various source PDFs. The extracted files are typically one-page PDFs. To extract the relevant pages I just printed them to doPDF.

The 12s0744.pdf isn't mine. I found it on the web. Somebody else was thinking along the same lines I was, apparently.

All files are stored on Google Drive, the old Google Docs.

PDFPAGESPERIODSOURCE
HS70 V 1-1211959-1966Historical Statistics (Bicentennial Ed.)
SA74 Table 77511967-1968Statistical Abstract (1974)
SA76 Table 82311969-1971Statistical Abstract (1976)
SA78 Table 91511972-1974Statistical Abstract (1978)
SA85 Table 86811975-1979Statistical Abstract (1985)
SA89 Table 84611980-1984Statistical Abstract (1989)
SA92 Table 82711985-1987Statistical Abstract (1992)
SA2000 Table 85511988-1994Statistical Abstract (2000)
SA0405 Table 71611995-1999Statistical Abstract (2004-05)
SA09 Table 72212000-2003Statistical Abstract (2009)
12s074412004-2008Statistical Abstract (2012)
Table Style by TextFixer.com

The source PDFs (large files) are still available from census.gov, but the 2012 Abstract is the last one they issued.

You know, spending cuts.

Monday, July 7, 2014

Preliminary notes: What does it mean when GDS increases relative to GDP?


I showed this graph on 2 July:

Graph #1: Gross Domestic Spending as a Percent of Gross Domestic Product
It turned out that the raised area, in the 1970s and thereabouts,showed a fair similarity to the rate of inflation in those inflationary years.

Got me thinkin'

//

GDP is Gross Domestic Product, the the sum of final spending in our economy in a year. GDS is Gross Domestic Spending, the total of final and non-final spending in our economy in a year. The increases in GDS are measured in dollar volume, not "number of transactions" or any such thing. It's a dollar number. So if GDS increases it is because spending increased, plain and simple. Same with GDP.

One major effect of a change in the GDS/GDP ratio would seem to be a change in spending pressures -- that is, inflation pressures.

//

Whatever cause may lie behind the increase in spending, then, one fact remains: the spending increased. The trend of GDS/GDP, then, in the 1970s, was that costs increased faster than income: GDS increased faster than GDP.

If this is correct, I must be able to see it in business profits -- perhaps profits relative to GDP, certainly in profits relative to expenses.

I'll take that challenge.

Graph #2:Total Business Deductions Peak in 1982 as a Share of Gross Income
Yeah. It stands up to the challenge. Spending increased faster than revenue until 1982, and more slowly after that year.

If deductions rose till 1982 and then fell as a share of revenue, then profit must have done the opposite:
Graph #3: Business Profits hit bottom in 1982, Trending Upward Thereafter
That should come as no surprise.

Profits tended down until 1982, and up thereafter.

Sunday, July 6, 2014

In case you missed it yesterday


A comparison of gross output, the output consumed by production, and the net output that remains, as against Gross Domestic Product and my measure Gross Domestic Spending, which adds nonfinal business spending to GDP:

Here's the picture:

Graph #2
The blue line is U.S. Gross Output -- the measure of what we produce in a year.

The red line is intermediate consumption -- the measure of output consumed in the process of producing output. It is almost half Gross Output. The red is almost half the blue.

The green line is output left over after using up output (red) to produce output (blue). The green line is just a little over half the blue. The red line is just a little under half; the green is just a little over.

The gold line is GDP. It is approximately equal to the green. The gold line, we call it "gross" domestic product, but really it is the part of output left over after using output to produce output. Almost the same as the green line. It differs for reasons you can read at Wikipedia.

The brown line is Gross Domestic Spending. It is GDP plus the business spending that is written off as tax deductions in the process of producing output.


Data sources for Graph #2 --
Blue, Red, Green: UNSNA via UNdata.
Gold: FRED.
Brown: Arthurian.

Here's the Zoho.

Saturday, July 5, 2014

UNSNA: US Gross Output 1987-2011


UNSNA is UN SNA, the United Nations System of National Accounts. Like NIPA. Except "NIPA" is pleasing to the ear, and "UNSNA" sounds like something you'd wipe off with a kleenex.

I googled unsna data historical and found System of National Accounts 2008 - United Nations ... so I went there looking for data. I clicked DATA on their blue menu bar. That brought me to their National Accounts Data page. Text and links. At the end of the second paragraph is a link to UNdata. That's the one you want.

I suppose I could eliminate the previous paragraph and just give you the UNdata link direct. But I'm trying to give you a sense of the struggle, perseverance in the search for data. (Plus, I write this stuff down so I can find my way back later.)

Anyway, the UNdata page has a search box, so now we're making some progress. I searched for gross output. I got two hits. Two is good. What the hell am I supposed to do with 13 million hits?

I take Table 2.6 Output, gross value added and fixed assets by industries at current prices (ISIC Rev. 4) because it has 91124 records. The other one (ISIC Rev. 3) must be older, and has half a million records. Maybe I'll look at that later.

Now we're getting to the meat. The Rev. 4 link gives me this:


The main body of the default page is a table of info about Armenia. It consists of several columns of info I don't want. But there are select filters scrollboxes on the left. The first one is countries. So I can look at U.S. data instead.

Their scrollbar is neat. You just hover over the little down-arrow, and the list of countries scrolls, slow enough you can read it but not so slow that you're bored.

In the second filter box you can pick years for data. I want all the years, naturally.

Now the important part that you must not miss:

Just below the second filter list there is a link that says More. You'll want to click that. It lets you zoom in closer to the data you want.

Click the MORE and you get two additional filter boxes. At the top of the third box is "total economy". That's the one I want. The other options are industry-specific. I want big-picture.

The last filter box lets you pick the data you want to see. That's a big deal. Basically, I wanted the first three that appear in the filter window, the ones I saw at Wikipedia yesterday: Gross output, intermediate consumption and gross value added (the last of these being approximately equal to GDP).

Oh, and most important, be sure to click the Apply Filters link. It's below the last filter box. That's the magic that makes UNdata do what you want.

Oh -- funny thing. While writing this post I was going through the motions to verify the steps. But I didn't pick the country and the years before I clicked MORE. Then after I told you about all four filters, I tried to pick the U.S. and follow through the process. But the thing wouldn't let me pick the U.S. The list of countries scrolled down as far as the S's and no further.

I clicked LESS to go back to the two-filter screen and tried again. No good. But I refreshed the page, and then it worked okay. (In case you run into trouble using the thing.)


When I was done selecting my filter options I clicked APPLY FILTERS and the screen changed to show the data I wanted to see.

And if you don't know about CSV...


As the first of the UNdata screen-captures shows, across the top above the table of data are options including DOWNLOAD and SELECT COLUMNS. Both look useful.

I used DOWNLOAD, which gives some format options. First time, I tried XML. But when I loaded it into OpenOffice Calc I got a blank spreadsheet. So then I tried the "value separated" option identified as "comma" (Sheesh! What an awkward way to say CSV) and it worked fine. Gave me a ZIP file.

Had to extract the data file from the zip before I could use it. (I just put it on my desktop along with everything else.) Then I right-clicked the data file and picked "open with" OpenOffice Calc. A "text import" window opened. I checked COMMA and unchecked TAB (or something like that) to make the sample import look right, then clicked OK.

OpenOffice Calc opened the file right away. Excel would be as easy, maybe easier.

Now we're getting to the meat.


I saved the spreadsheet right away, in spreadsheet format. Otherwise, it stays as a CSV file. And CSV files can't save the formatting that spreadsheets do, so the next time you open the thing most of your changes are gone. Save it in spreadsheet format, and you solve that problem.

I bolded the column labels in row 1, set column widths, and made the text in column C wrap automatically. (That's the kind of formatting you lose if you keep the file as CSV.) Then, because I wasn't careful with the import, I had to go into column F and delete a single-quote from in front of the number, on every row.

Also, I deleted some columns that UNSNA thinks important and I don't. Then I uploaded it to Zoho so you can see what the thing looks like. Here's the Zoho:


The filename was set by the UNdata exporter.

The first row identifies the columns. Look at rows 2, 3, and 4, column C. There you have output, intermediate consumption, and gross value added (all for 2011, as column D shows). The next three rows have the same three items of data for 2010. The rows continue like that, back to 1987. Then, from 1986 back to 1970 the only data item is gross value added. Before 1970, nothing.

Still, we've got three items of data for the years 1987 to 2011. Not a bad start.

The biggest problem I have now is that all the numbers are in column F. That means I can't copy a chunk of numbers and get just gross output or just intermediate consumption or something. I get a jumble. In order for the data to be useful, I have to separate it into different columns by type (so I get three columns of data rather than one) and also combine the three rows for each year into one row. Then I get ONE row for 2011 with three columns of data, and ONE row for 2010 with three columns of data, and ONE row for 2009 with three columns of data... I could go on, but I think you get my drift. It's obvious, isn't it?

So why doesn't UNdata know this? I think they DO know it. They're not stupid. Maybe they just want to make it difficult. Hey, I've never seen this data used anywhere. Why not? I think people are discouraged from using the data because it is so much work to undo the stupidities built into it by people who surely should know better. I'm beating around the bush here, trying to avoid being explicitly rude.

Oh, well.

If you scrolled the spreadsheet enough to see column F, you saw that the numbers are given in dollars. I mean, if the value is 27,170.5 billion, UNdata gives it as 27,170,500,000,000. That's not easy to read; you have to count digits. So I want to convert their numbers to billions. The numbers will be easier to read that way, and compatible with FRED's numbers.

That, and I want to convert the three-row-one-column format to one-row-three-columns, so the data is useful.

Now we're getting to the meat.


I copied the original data (Sheet1) to a new sheet to make the changes.

Figured out a calculation to move the data for me into the format that I want. It's in the first few columns of Sheet2 in this Zoho file. (It only applies to the data back to 1987, where there are the three different values for each year. For 1986 back to 1970 I just copied and pasted the range of cells.)

Turns out that, like my column F values, my year values had the single-quote mark that left-justifies them and makes them behave like text instead of numbers. Next time I'll have to be more careful with the import from CSV.

I copied Sheet2 to make a new sheet and called it Sheet3. On the new sheet I copied the first few columns and pasted them as values over top of the calculations. After that I could delete the source data that was formatted badly, clean up the sheet, and credit UNdata for the data.

And of course, they also present the data backwards, newest first, rather than chronologically. I sorted that. Here's what I have so far -- data now ready to use.

Now we're getting to the meat.


Now I was ready to look at the numbers.
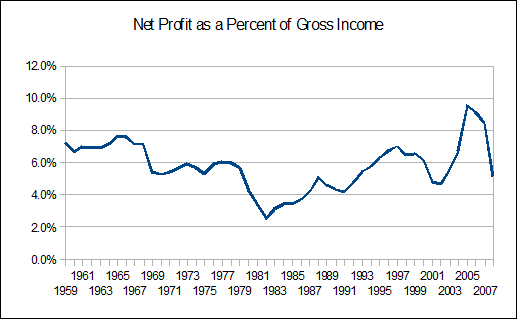
Graph #1

I noticed Wikipedia said

In the US economy, total intermediate consumption represents about 45% of Gross Output.
That's about right, for the blue line, since 1997 or so. More like 42% before that. And it looks like a trend of increase (for the blue line) and decrease (for the red).

Also... when you say "average" it suggests up-and-down variation, but it also implies stability in the value. If intermediate consumption is trending upward as a share of gross output, it is deceptive to speak of its average value. Would be nice if the values went farther back in time, so one could be more certain about trends.

Now we're getting to the meat.


Another thing the Wikipedia article said was that "gross output" is what we produce in a year, but we use up "intermediate consumption" in the process, which leaves us with "net output" which his just about the same as "GDP". That's four different data series right there.

To those four I want to add my context variable "GDS", gross domestic spending. That gives us five series to look at on one graph. You with me? Usually if I have more than two lines on a graph I start to lose clarity. This time it's five. But we're only looking at their relative sizes. That's straightforward.

The source for this graph is the same file as the Shares of Gross Output graph above. It's on the next tab to the right, so you can look at the numbers if you want. Here's the picture:

Graph #2
The blue line is U.S. Gross Output -- the measure of what we produce in a year.

The red line is intermediate consumption --  the measure of output consumed in the process of producing output. It is almost half Gross Output. The red is almost half the blue.

The green line is output left over after using up output (red) to produce output (blue). The green line is just a little over half the blue. The red line is just a little under half; the green is just a little over.

The gold line is GDP. It is approximately equal to the green. The gold line, we call it "gross domestic product", but really it is the part of output left over after using output to produce output. Almost the same as the green line. It differs for reasons you can read at Wikipedia.

The brown line is Gross Domestic Spending. It is GDP plus the business spending that is written off as tax deductions in the process of producing output.


Data sources for Graph #2 --
Blue, Red, Green: UNSNA via UNdata.
Gold: FRED.
Brown: Arthurian.