Monday, December 31, 2012

A wicker basket, a money basket or chest, the public treasury


I like to see what word origins tell me.


These two scans are from the yellowed pages of Webster's New Twentieth Century Dictionary of the English Language, unabridged; The World Publishing Company, Cleveland and New York, 1950.

Sunday, December 30, 2012

Not since the 1953 recession


When the "percent change" goes below zero, the spending is going down.

Saturday, December 29, 2012

I'll call him on it


On my desktop, a shortcut title catches my eye: 2% Real Per-Capita GDP Growth A Long-Term Trend We Can Count On - Seeking Alpha.

The link opens a page on Seeking Alpha, by Mark J. Perry. Here's a bit:
(Click to enlarge)
Over the last 200 years, going back to 1809, the chart above shows that the growth in real GDP per capita in the U.S. has been amazingly constant at an average of 2% year, with fluctuations around that long-term secular trend.
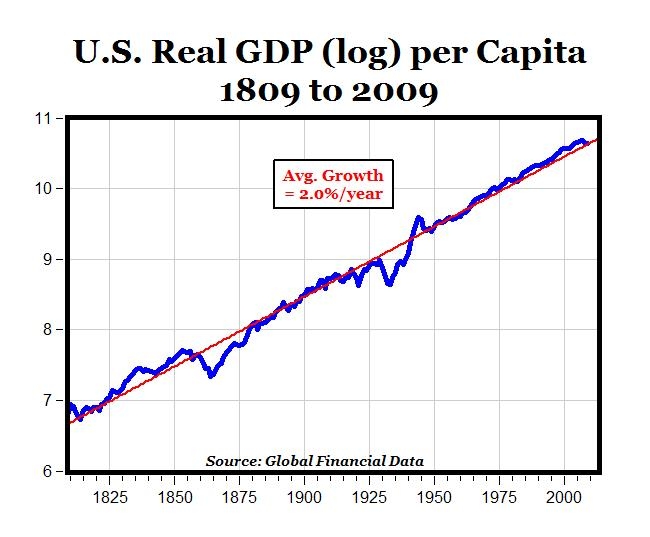
Now I have to say, I have never come across a Mark J. Perry post that I thought was any good at all. But I don't go looking for Perry garbage. I trip over it. As you know, I'm fascinated by graphs and by GDP growth. I left that link on my desktop a while back because it looked interesting.

Ha.

I tried to duplicate the graph. It's a joke. Perry says the growth works out to 2% per year. But it's only about 1.75%.

When it comes to long-term growth rates, 1.75% is not even close to 2%. After 200 years, 1.75% growth produces a 32-fold increase. 2.0% growth produces a 52-fold increase. There's no comparison.

It could be a rounding error -- but it can't be a rounding error, because they don't call it two percent. They call it two point oh percent. 2.0% means the number before rounding was between 1.95 and 2.049 or so. 1.75% would round to 1.8%, not 2.0%

So, it's bullshit.


Graph #2: Real GDP per Capita (blue) and 2% Growth (red)
(Not on a Log Scale)

U.S. Real GDP per Capita data from Measuringworth: Louis Johnston and Samuel H. Williamson, 'What Was the U.S. GDP Then?' MeasuringWorth, 2012.

I put the data into a Google Docs spreadsheet on Google Drive. (Is that the proper way to say that?). On the Tweak the Trend sheet you can change the numbers in the yellow cells -- the starting value, and the growth rate -- to change the trend line on the graph. See if you can duplicate Mark J. Perry's graph using 2.0% growth. I dare ya!

(Note: I "shared" the file and clicked the setting so you can "edit" it. Please change only the numbers in the yellow cells on the "Tweak the Trend" sheet. Or make yourself a copy of the file to modify as you will.)

I took another look at the RGDP PC numbers in an Open Office spreadsheet. You can download it at the link.

And here's a link to a help page on Calculating Geometric Growth:
http://arnoldkling.com/econ/GMU/growthArith.htm
I used the notes on "Solving for Average Growth" for the "Kling Calc" in both spreadsheets.

New since I was last at Measuringworth: There is now an option to download your selected data as a CSV file for import to a spreadsheet. Nice! But I imported it carelessly into the Open Office sheet, and the numbers came in as text and had to be tweaked. (I just used the =VALUE() function on them.)


Friday, December 28, 2012

Eisenstein the Forgiving


From The Guardian, the inappropriately-titled We can't grow ourselves out of debt, no matter what the Federal Reserve does by Charles Eisenstein (3 September 2012):
For example, what if quantitative easing were combined with debt forgiveness? The banks get bailout after bailout – what about the rest of us? The Fed could purchase student loans, mortgages or consumer debt and, by fiat, reduce interest rates on those loans to zero, or even reduce principal. That would liberate millions from the debt chase, while freeing up purchasing power for those who are truly underconsuming.

More radically, central banks should be allowed to breach the "zero lower bound" that has rendered monetary policy impotent today. If investors are unwilling to lend even when risk-free return on investment is 0%, why not reduce that to -2%, even -5%? Implemented as a liquidity tax on bank reserves, it would allow credit to circulate in the absence of economic growth, forming the monetary foundation of a steady-state economy where leisure and ecological health grow instead of consumption.

Excellent bits of an otherwise confused article.

Thursday, December 27, 2012

Trickle-Down Monetary Policy


From Fed’s $4 Trillion Rescue Helps Hedge Fund as Savers Hurt:
Bernanke said last year that the Fed aims “strictly to do what’s in the interest of the broad public.”

He said last week that the policies are intended to “try and create a stronger economy, more jobs, so that folks across the country, including places like the one where I grew up, will have more opportunity to have better lives for themselves.”

Bernanke said last week the central bank will purchase $85 billion of assets a month next year “to increase the near-term momentum of the economy.”

Purchasing assets removes those assets from the economy and replaces them with new money. But what is an asset? An asset is somebody's liability.

I buy a house. I get a mortgage to buy the house. The house is my asset and the mortgage is my liability. Forget about the house.

I get a mortgage. I get an asset (the house. Forget about the house), and the lender gets an asset. The asset the lender gets is my promise to pay back the loan.

My promise to pay back the loan is my liability. It influences all my spending decisions for the next 30 years.

My IOU is an asset to the person I am paying, and it is a liability to me because I am paying. The fact that I'm paying is what makes the IOU an asset to the other guy.

Along comes the Fed, giddy buyer of assets. The Fed buys my IOU from my lender and pays the lender with the-ink-is-still-wet money.

The... what do they say? The "composition of the bank balance sheets" has changed. Yeah, okay, fine. The guy that used to have my IOU now has cash. He got satisfaction. He got what he expected to get, eventually, for the IOU. But there is more to the story than that.

The Fed buys the IOU from my lender. The lender gets cash. And I get to make the same payments I made before, except now I pay somebody else. That really doesn't do much for me. It doesn't do much for the economy, either.

Purchasing assets removes those assets from the economy, replacing them with money. But the liabilities remain as they were: draining income, depressing demand, hindering economic growth.

If I'm just squeakin by, barely getting from paycheck to paycheck or maybe not even, I don't give a rat's ass if I'm paying the original lender or the asset-buyer of last resort. I have more pressing concerns.

Those concerns are not addressed by the Fed's asset purchase policy.

Now, if the Fed bought my IOU and cancelled it, it would remove a liability from the economy. This is what needs to be done to bring our economy back to life: Reduction of liabilities, not assets.

Remember back when this whole thing started, the word of the day was "deleverage". People wanted to reduce their debt: People wanted to reduce their liabilities.

The catch-phrase at the time was "toxic assets". What is a toxic asset? Something like my IOU if I'm failing to make the payments. Toxic assets are liabilities going bad.

What the Fed did was, it started buying the toxic assets. Started buying the bad IOUs. It took bad IOUs out of the economy and replaced them with new money. But the IOUs still exist, and they are still iffy. Meanwhile, we are still trying to make the payments, and this is still undermining demand and hindering economic growth.

See the problem?

Wednesday, December 26, 2012

"These facts from experience are a prima facie ground for questioning the adequacy of the classical analysis." (Ch. 2)


The title is a line from Keynes. Key phrase: "facts from experience".

Tom Hickey quotes Lars P Syll:

Neoclassical economics has since long given up on the real world and contents itself with proving things about thought up worlds. Empirical evidence only plays a minor role in economic theory, where models largely function as a substitute for empirical evidence.

I quote my Blogger profile:

About the first thing I noticed was that hardly any of the graphs in the textbook were based on actual numbers.

Three of a kind, I'd say.

Tuesday, December 25, 2012

The Wisdom of Adam Smith

From The Wealth of Nations, Book 4, Chapter 1:

A rich country, in the same manner as a rich man, is supposed to be a country abounding in money; and to heap up gold and silver in any country is supposed to be the readiest way to enrich it. For some time after the discovery of America, the first inquiry of the Spaniards, when they arrived upon any unknown coast, used to be, if there was any gold or silver to be found in the neighbourhood? By the information which they received, they judged whether it was worth while to make a settlement there, or if the country was worth the conquering.

Plano Carpino, a monk sent ambassador from the king of France to one of the sons of the famous Gengis Khan, says, that the Tartars used frequently to ask him, if there was plenty of sheep and oxen in the kingdom of France? Their inquiry had the same object with that of the Spaniards. They wanted to know if the country was rich enough to be worth the conquering.

Among the Tartars, as among all other nations of shepherds, who are generally ignorant of the use of money, cattle are the instruments of commerce and the measures of value. Wealth, therefore, according to them, consisted in cattle, as, according to the Spaniards, it consisted in gold and silver. Of the two, the Tartar notion, perhaps, was the nearest to the truth.


Merry Christmas.

Monday, December 24, 2012

Cost-Push Inflation: An Issue Resolved, or Simply Dismissed?


At The Everyday Economist some months back, Josh Hendrickson captured my attention with his Nominal Income and the Great Moderation. In that post, Hendrickson introduced a forthcoming paper and said:

As I argue in the paper, during the Great Inflation period of the 1970s, members of the FOMC regularly asserted that the process of inflation determination had changed. Relying on public statements and personal diary entries from Arthur Burns, I demonstrate that there is little evidence that the Federal Reserve was less concerned with inflation during the 1970s. Rather, the view of Burns and others was that inflation was largely a cost-push phenomenon. Burns thought that incomes policies were necessary to restore price stability and stated that “monetary and fiscal tools are inadequate for dealing with sources of price inflation that are plaguing us now.”

The shift in policy, beginning with Paul Volcker, was an explicit attempt to stabilize inflation expectations and this was done deliberately at first through monetary targeting and ultimately through the stabilization of nominal income growth. Gone were notions of cost-push versus demand-pull inflation.

I can see a natural progression there: from the thought that "incomes policies were necessary" to policies for "the stabilization of nominal income growth." Incomes policies means wage-and-price controls. The method is crude, but the objective of wage and price controls is precisely "the stabilization of nominal income growth."

Beside the point. What concerns me is "the view of Burns and others was that inflation was largely a cost-push phenomenon." That, and the apparent fact that this issue of cost-push was never resolved. It was simply dismissed.

"Gone were the notions"

At this writing there remain just six comments below Josh Hendrickson's post. Make that five comments and a pingback.

First, Nick Rowe quoted Hendrickson -- a piece of the excerpt above, actually:

Josh: “Rather, the view of Burns and others was that inflation was largely a cost-push phenomenon. Burns thought that incomes policies were necessary to restore price stability and stated that “monetary and fiscal tools are inadequate for dealing with sources of price inflation that are plaguing us now.””

And he remarked:

People forget (and maybe younger people never knew) just how common that view was in the 1970′s. It was common among economists as well as the general population. It was almost the orthodoxy of the time, IIRC. Tighter monetary policy would just raise interest rates, which would increase costs, and make inflation even worse.

It was a common view at the time, Nick says, that cost-push forces were at work. Noted. In the next comment, Josh Hendrickson agreed with Rowe, saying

Burns’ view is consistent with the orthodoxy of the time — as epitomized, for example, by Samuelson and Solow (1960).

"Consistent with the orthodoxy of the time." A common view.

In the third comment, Marcus Nunes agreed as well. He offered a post of his own, on the same topic. (I spent a lot of time with the post from Marcus.)

In the fourth comment, Bill Woolsey asked

There were really _economists_ who thought that “tighter money” would raise inflation through a cost-push mechanism?

Woolsey says he'd heard the argument, but always figured it expressed "special interest" concerns.

So let me ask a question now, about Woolsey's question: Why does he ask? Is it because the cost-push issue was so well resolved that it never arose in all of Bill Woolsey's experience? Or is it that the matter was carelessly dismissed, as opposed to actually being resolved? I don't have the knowledge to answer that question, but it sure feels like the matter was carelessly dismissed.

The last comment is mine. I quoted the economist Robert V. Roosa from the September 1971 Fortune magazine:

And yet another factor has been the undue reliance on restrictive monetary policy to limit demand, with the perverse result of making interest rates themselves a major cost-push force.

After the Roosa quote I said, "I’ll swap that for two or three hobbyist-level links explaining what’s wrong with the idea."

Ten months later, still no response. To me, the issue looks unresolved.

Sunday, December 23, 2012

Gain of Knowledge


Drives me crazy that people insist on saying things like money is debt because it is created from an IOU ... or money is credit because it is created by crediting accounts. You might as well say people are dust, because we come from dust and to dust we shall return.

Now there may be some sense to looking at things that way, if you want to put on your philosopher's glasses and squint real hard. But there is no gain of knowledge by it. Not that I can see.

Here's mine:

The act of converting "available credit" to "credit in use" creates money. But money is not the same as available credit, and money is not the same as credit in use.

The act of converting available credit to credit in use creates money and debt at the same time. But the money is not the debt, and the money is not the credit, and the credit is not the debt, and the debt is not the money, and the credit is not the money.

Saturday, December 22, 2012

LL&J4A: Debt-Reset Is Inevitable


A pretty damn good blogger who identifies him herself only as "anonymous" writes:

There is mounting evidence that at high private debt loads, the purchasing power of debt has diminishing returns... If so, it might be the case that small amounts of public debt at low private debt/GDP ratios can purchase staggering GDP growth rates, but that large amounts of public debt at high private debt/GDP ratios will purchase decreasingly positive GDP growth rates until the GDP growth rate is zero.

Here, read it again:

If so, it might be the case that small amounts of public debt at low private debt/GDP ratios can purchase staggering GDP growth rates, but that large amounts of public debt at high private debt/GDP ratios will purchase decreasingly positive GDP growth rates until the GDP growth rate is zero.

You can tell I think that's good. I don't double-quote just anyone.

Friday, December 21, 2012

Wage-push inflation, my ass

The Wealth of Nations, Book 1, Chapter 9: The Profits of Stock:

In reality high profits tend much more to raise the price of work than high wages. If in the linen manufacture, for example, the wages of the different working people, the flax-dressers, the spinners, the weavers, etc., should, all of them, be advanced twopence a day; it would be necessary to heighten the price of a piece of linen only by a number of twopences equal to the number of people that had been employed about it, multiplied by the number of days during which they had been so employed. That part of the price of the commodity which resolved itself into wages would, through all the different stages of the manufacture, rise only in arithmetical proportion to this rise of wages.

But if the profits of all the different employers of those working people should be raised five per cent, that part of the price of the commodity which resolved itself into profit would, through all the different stages of the manufacture, rise in geometrical proportion to this rise of profit. The employer of the flaxdressers would in selling his flax require an additional five per cent upon the whole value of the materials and wages which he advanced to his workmen. The employer of the spinners would require an additional five per cent both upon the advanced price of the flax and upon the wages of the spinners. And the employer of the weavers would require a like five per cent both upon the advanced price of the linen yarn and upon the wages of the weavers.

In raising the price of commodities the rise of wages operates in the same manner as simple interest does in the accumulation of debt. The rise of profit operates like compound interest.


Marcus ribbed me a few days ago for being stuck on the same topic I was stuck on "5 months ago".

Five months is nothin. As you can see from the title of this post, I'm still stuck on what it was that drove the inflation of the 1970s! But you know, you cannot understand the present if you misunderstand the past.

Thursday, December 20, 2012

"...the workers, though unconsciously, are instinctively more reasonable economists than the classical school..."


No one is arguing that technology didn't advance.

Mark J. Perry offers us Christmas shopping: 1958 vs. 2012, in which he compares the price of toasters, televisions, and music devices over time. He writes:

If you’re not convinced that today’s consumers are better off than at any time in history, spend some time browsing the old Sears, Wards, and J.C. Penney’s Christmas catalogs...

But can you imagine how bad things would be if technology didn't improve, and all the things that went wrong still went wrong?

The title of this post is something Keynes wrote.

And as for what I want to say to Mark J. Perry, well, as Leslie Winkle said to Sheldon Cooper: Dumb-ass.

Robert Nielsen: "Economics does not talk about fight club."


Nielsen doesn't say what textbooks they use in his classes. But he does say some interesting things about what he's being taught:

In my course I have basically been taught that the free market is the most efficient and best system in the world and trouble always results when it is interfered with. In my textbooks recessions are not mentioned, they do not happen. There is no explanation of unemployment, the biggest issue of our times. There is no mention of profit, the heart of capitalism. Nor do they talk about banks or money or advertising or how systems are guided by power relations. No mention is made of poverty, in effect ignoring three-quarters of the world.

The idea that the market could fail is never given a moment’s thought. The market is always assumed to be in equilibrium, providing the greatest good for the greatest number of people. If you thought the current crisis would have changed this thinking then you would be wrong. The older pre-recession editions of textbooks are essentially the same as the newer post-recession textbooks. Mainstream economics has cut itself off from the real world and instead built a fantasy utopia.

Unemployment is a thought never far from mine or my generations mind. It is the biggest problem affecting millions of people the world over, yet traditional economics offers no explanation of it. I will graduate with a degree in economics in six months time, yet I couldn’t tell you why some people are unemployed.

Reminds me of what the well-respected N. Gregory Mankiw said in regard to the money multiplier: "Each dollar of the monetary base produces m dollars of money"

And that's from the 2011 edition of his book.

What is it Nielsen said? If you thought the current crisis would have changed this thinking then you would be wrong.

Wednesday, December 19, 2012

Fluffing off a Trillion Dollars. And a Third Thing


Krugman: Further Notes on ONE TRILLION DOLLARS

Yesterday I noted that the preoccupation with the size of the current deficit — which, as everyone reminds us, is ONE TRILLION DOLLARS — is completely misguided. Since then I’ve done some more arithmetic, which solidifies the point.

So, in fiscal 2012 (which ended September 30) we did in fact have a federal deficit of $1.1 trillion (pdf). The question is, however, whether this deficit represents, as everyone claims, a fundamental mismatch between what we want and what we’re willing to pay for — or whether it’s mainly just a reflection of the depressed state of the economy.

Krugman does some magic with numbers and makes that trillion dollars disappear one-two-three:

1. Growth and inflation: $400 billion


Krugman boldly goes where everyone has been before, writing:

we don’t need a balanced budget to have a stable fiscal situation; all we need is for debt to grow no faster than GDP.

Krugman figures nominal GDP grew about 4% over the past year, so that a 4% increase in the Federal debt shouldn't even be counted. Given a Federal debt of $10 trillion at the start of fiscal 2012, Krugman gets to say $400 billion of the 2012 deficit ought not even be counted.

(Conveniently, the trillion-dollar deficit means Krugman can come back next year and use the same argument to justify even more than $400 billion: Given a Federal debt of $11 trillion at the start of fiscal 2013...)

2. The Full Employment Budget: $450 billion


He doesn't call it full-employment budgeting, but that's what it is. The old-school, Arthur Okun style, JFK-era, full employment budget idea. I was shocked to see Krugman pull this one out of the hat. I'm not touching it; here is his paragraph complete. See for yourself:

OK, revenues were $2.45 trillion, which was 15.7 percent of GDP, at $15.5 trillion. The CBO estimates, however, that potential GDP — what the economy would have produced at full employment — was $16.5 trillion over the same period. And if the economy had been at more or less full employment, we wouldn’t just have collected taxes on the additional income; historically, the tax share of GDP varies strongly with the business cycle. If the economy had been at potential and revenue had been a historically normal 18 percent of GDP, revenue would have been more than $500 billion more than it was; even if revenue had been only 17.5 percent, it would have been almost $450 billion more than it was.

He even uses the phrase "full employment".

Revenues were low because the economy was running below potential, Krugman says. It's true, no doubt. But why are we below potential? And why is "potential" all downhill? Krugman doesn't get into it.

The full-employment idea is that it is "okay" for the Federal government to spend as much as it would bring in if the economy was performing at peak. This is exactly the same idea that was used back in the 1960s. Time magazine, 1965:
Kennedy's economists, led by Chief Economic Advisor Walter Heller, presided over the birth of the New Economics as a practical policy and set out to add a new dimension to Keynesianism. They began to use Keynes's theories as a basis not only for correcting [recession]... but also to spur an expanding economy to still faster growth.

Kennedy was intrigued by the "growth gap" theory, first put across to him by Yale economist Arthur Okun (... a member of the Council of Economic Advisers), who argued that even though the United States was prosperous, it was producing $51 billion a year less than it really could.
From article in Time. 86:64-7B. D. 31, '65. Reprinted in Stabilizing America's Economy, edited by George A. Nikolaieff. The Reference Shelf, Volume 44 Number 2. The H.W. Wilson Company, New York, 1972. Page 54.

(Permit me to point out that in the same Time article we read that "Some Keynesians believe that these policies violate Keynes's theories". That's what I think. Much of the criticism that has been directed at Keynes over the years applies not to Keynes, but to the "Keynesians" who added "a new dimension" to what the man said.)

In 1971 Roland Evans and Robert Novak described the full-employment budget:
An old proposal by liberal economists for the past generation, it envisioned the budget being balanced when expenditures were no higher than revenue would be if there were full employment (that is, unemployment no higher than about 4 percent).
Article: "Nixonomics: How the Game Plan Went Wrong," by Rowland Evans, Jr., and Robert D. Novak, syndicated columnists and authors of several books on politics, as it appeared in Atlantic Monthly, 228:66-80.Jl. '71. Reprinted in Stabilizing America's Economy, edited by George A. Nikolaieff. The Reference Shelf, Volume 44 Number 2. The H.W. Wilson Company, New York, 1972. Page 156.

And again, in 1972, in the Christian Science Monitor, Courtney R. Sheldon described the concept of the full-employment budget:
The dictum of this concept is that spending be held only to the level of tax revenue that would be collected if the jobless rate were at the full-employment level of 4 percent.
Article, "Nixon Primes Economy With Deficit Tide," by Courtney R. Sheldon, chief of Washington bureau. Christian Science Monitor, p 1+. Ja 25, '72. Reprinted in Stabilizing America's Economy, edited by George A. Nikolaieff. The Reference Shelf, Volume 44 Number 2. The H.W. Wilson Company, New York, 1972. Page 40.

3. Slump-related expenses: $150 billion


Government spending increased in the wake of the recession. Krugman says that a large part of the increase was for "'income security' payments — in this case, basically unemployment insurance and food stamps".

And there's your trillion dollars.


But there is something else, something far more important than Krugman's analysis of cost and spending. In his opening, Krugman brings up the trillion-dollar deficit, then asks a question:

The question is, however, whether this deficit represents, as everyone claims, a fundamental mismatch between what we want and what we’re willing to pay for — or whether it’s mainly just a reflection of the depressed state of the economy.

The correct answer to that question is: No.

A fundamental mismatch? No. The depressed economy? No. It is something else, a third thing. The deficit is a measure of how much policymakers misunderstand their trade. A measure of policy mistakes.

No, not spending. The deficit isn't a result of spending. It is a result of policy: of fighting inflation, and encouraging growth. The deficit is a result of these two policies, done in a very bad way for a very long time.

Policymakers pushed down the quantity of money in circulation to fight inflation:

Graph #1: Money in the Spending Stream per Dollar's Worth of Output
Click Graph for FRED Source Page

At the same time, they encouraged growth, spending, and the use of credit:

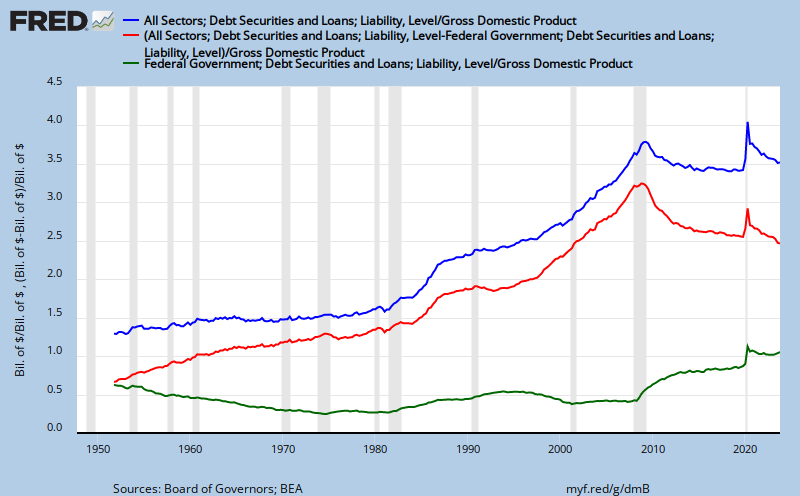
Graph #2: Total Credit Market Debt Owed per Dollar in the Spending Stream
Click Graph for FRED Source Page

The honest and honorable goals of fighting inflation and encouraging growth turned us into a nation with no money and inexplicable debt. That is why the economy refuses to grow. That is why tax revenue is down and "slump-related expenses" are up.

And that is why we have trillion-dollar deficits.

Tuesday, December 18, 2012

Bloomberg: "I have signed on as a co-chair of the Campaign to Fix the Debt"


Bloomberg is talking about the Federal debt.

Private debt is the problem that must be solved first. Not public debt.

Michael Bloomberg: Avoid the ‘cliff,’ restore the confidence


From the Washington Post, 12 December 2012:
Avoid the ‘cliff,’ restore the confidence
By Michael Bloomberg

Five years after we entered a historic national recession, the U.S. economy is still only sputtering along. Why? Some say the recession was just too deep to expect anything but a weak and prolonged recovery. Some say the stimulus was too small or poorly targeted. Or the plan to stabilize housing prices was too big or too small. Or government is taxing people too much or too little.

All of these issues made for interesting debates during the presidential campaign. But none explains why the national economy is still so weak.

Bloomberg asks why the recovery is weak. He doesn't like the answers. But he asks the wrong question.

Instead of considering what's special about the recovery, Bloomberg should ponder what was special about the recession we're trying to recover from.

He knows the answer.


Bloomberg identifies "the economy’s chief underlying problem:"

the lack of confidence businesses and individuals have in Washington’s ability to ensure stable market conditions.

The lack of confidence? Bloomberg mistakes results for causes. The lack of confidence in "Washington's ability to ensure stable market conditions" is a result of Washington's inability to ensure stable market conditions.

The chief underlying problem is not the lack of confidence, but the inability to provide a healthy economic environment. You know: "stable market conditions".

Why can we not achieve this healthy environment? Bloomberg knows the answer:

Unlike in the run-up to the 2008 crash, when businesses took too much risk, today they are not willing to take risks we need them to take.

Today, unwilling to take risks, "businesses are sitting on record amounts of capital." They're not spending. We're not spending.

In the run-up to the recession, Bloomberg notes, it was just the opposite: They were spending too much. We were spending too much. We were creating too much debt. Excessive accumulation of debt is what happened during the "run-up" to the crash. Excessive accumulation of private sector debt.

Most of that debt is still with us. This is the reason we cannot recover. But now Bloomberg expects us to create more debt, again. Silly man.

So says the billionaire


The steps we need Congress to take to get the economy moving again do not require money; they require leadership.

Monday, December 17, 2012

At the Peak of Private Debt


A comparison of private debt in recent years and at the time of the Great Depression:

Graph #1: Debt at the Peak
Blue = Great Depression years; peak year 1929.
Red = Recent years; peak year 2008.

Debt is shown relative to the size of the peak year debt, for three years before and after the peak.

In the years just before the peak, the red line goes up faster than the blue. We were accumulating debt faster in recent years, than they were in the late 1920s.

In the years just after the peak, the blue line goes down faster than the red. They were getting rid of debt faster in the early 1930s, faster than we are today.

If excessive private debt is the cause of our economic troubles, then we are not doing a good job solving the problem; they did better after the Great Depression.

The last years shown on the graph are 1932 (blue) and 2011 (red). During the Great Depression, private debt continued to decline for three years after the last year shown. After the current crisis, the decline of private debt appears to have stopped already.

If excessive private debt is the problem, we are not dealing with the problem.


Depression-era numbers: "Private" debt (Series X398) and "Total" debt (Series X393) from Historical Statistics of the United States: Colonial Times to 1970.

Current-era numbers: Total debt (TCMDO) and Non-Federal debt (TCMDO less FGTCMDODNS) from FRED.

This Google Drive spreadsheet contains graph and data.

Sunday, December 16, 2012

Kervick: "People always want monetary systems"


Dan Kervick comments at Mike Norman's:
A lot of these "end of money" guys seem confuse money per se with physical currency.

If you have a system in which you can accumulate and hold any kinds of points or credits in exchange for goods and services, then you have a monetary system.

If you have any administrators or systems, public or private, for storing these points or credits electronically, and protecting your legal title to them, then you have a system of banks of one kind.

If you have a system for exchanging points that you already possess with someone who wants them, in exchange for a promise of a greater quantity of points to be delivered back to you later, then you have banks in the full blown sense.

This is exactly right. If there is something that you earn, spend, and hope to save, then that thing is money. No matter what you call it, it is money.

Here's mine.

Adam Smith on Financial Cost

The Wealth of Nations, Book 3, Chapter 2: The Discouragement of Agriculture:

The farmer, compared with the proprietor, is as a merchant who trades with borrowed money compared with one who trades with his own. The stock of both may improve, but that of the one, with only equal good conduct, must always improve more slowly than that of the other, on account of the large share of the profits which is consumed by the interest of the loan.

Saturday, December 15, 2012

Yglesias: The Cult of "Price Stability" Is Killing American Workers


From Slate MoneyBox:
The declining labor share of national income isn't the result of mysterious technological forces; it's the result of policy choices, specifically macroeconomic stabilization policies. Specifically the idea that the thing that macroeconomic policy ought to stabilize isn't output or employment but inflation—which is to say wages.


You often hear members of the central banking establishment allude to the "hard won" battle against inflation in the early 1980s. But the battle was in fact won very quickly and decisively. And not coincidentally, since the victory the labor share has tended to steadily decline as seen above.
Question: If labor share has been trending down since 1980, how come we still have inflation? Prices should have been not only stable, but falling.

Answer: There is something other than labor cost that is pushing prices up.


What's that? There was no inflation for the past 30 years, you say?


Oh right, right, right.


Well, the good thing is that from facts in evidence -- specifically, the declining labor share -- it is clear that labor is not to blame for inflation.

I push this thought back to the 1970s when inflation was raging and wages did better at keeping up with it. In those days, wages were keeping up or, at least, not falling so far behind. But they were not then either the driving force behind inflation.

Oh, wages were blamed for inflation, sure. But that's not the same thing.

What is the same is the "something else" -- other than wages -- that led to increasing wage demands during the Great Inflation and remains the cause of inflation today, when wages are clearly not the driving force.

The "something else" is cost. Specifically? The cost of finance.

// Update

Related post: "One for You, Three for Me"

Friday, December 14, 2012

Tyler Durden: "The World is Waiting"


In a post that is entirely too long, someone calling himself Tyler Durden writes:

The primary difference between today and the 1930s, when the U.S. experienced its last systemic crisis, has been the response by policymakers. Having the benefit of hindsight, policymakers acted swiftly to avoid the mistakes of the Great Depression by applying Keynesian solutions.

What we did this time, that we failed to do last time, was prevent the collapse of the banks and private debt. Our debt lingers. But excessive accumulation of debt was the underlying cause of the crisis. So along with debt, unemployment lingers. Recovery remains impossible.

The Depression hit in 1929. Maynard's book came out seven years later.

By the time The General Theory was published, a lot of debt was already gone. Keynes didn't have to deal with that. He didn't have to say Get rid of the debt first. The debt spike was a thing of the past.

We don't have that luxury. Isn't it obvious?

Thursday, December 13, 2012

Curvature of the Spine


Industrial Production, Backbone of the Economy

Wednesday, December 12, 2012

Simulacron: Make that three trends


Graph #2 from mine of 28 November, renumbered:

Graph #1: RGDP Fitted to the Trend Lines

The blue line shows Real GDP. The red line is an exponential trend fitted to the RGDP data for the period 1947-1979. The green line is an exponential trend fitted to the 1980-2007 period. You can see that RGDP growth appears to have slowed around 1980, so that the green trend line falls away from the red trend line.

You can see RGDP growth slow again around 2008, as the blue line falls away from the green trend line. That little blue tail over on the right seems an awful lot like the start of a third trend, lower yet than the one that dies out in 2007.

I took another look at the numbers, quarterlies this time. I made close-up graphs of the trend transition periods and selected "best case" dates for the trend start- and end-points.

As in the earlier post I let Excel generate exponential trend lines and formulas for the three periods. I gathered up the numbers needed to duplicate the trend lines and put them into a table along with compound annual growth rate (CAGR) values for the three periods:


And I plotted the RGDP numbers along with the three trend lines, extending the latter out to the fourth quarter of 2020:

Graph #2: Stages of the slowdown in real growth
By the fourth quarter of 2007 when real GDP reached 13.3 trillion, blue trend GDP was 17 trillion, more than 25% greater.

By the third quarter of 2012, with the most recent real GDP number at 13.6 trillion, the yellow (1982-2007) trend shows 15.8 trillion, and the blue trend shows 20.3 trillion real GDP. For every dollar of income you earn today, the blue trend would have got you a dollar and a half.

By the fourth quarter 2020, the present trend suggests 16.25 trillion RGDP. The 1982-2007 trend would have brought us to 20.5 trillion. And the 1947-1980 trend shows 27.6 trillion real GDP.


So the next time somebody shows you a graph of RGDP with a constant-rate-of-growth trend line through it like this one,

Marcus's graph

and when they tell you

It´s more or less recognized that US RGDP is trend stationary (maybe that´s changed now!), with real growth averaging about 3.3% from the early 50s to 2007

well, do not hesitate to respond Yeah, maybe that´s changed now!


Preview or download the SIMULA 7 Q&A.XLS file containing these graphs. (Q&A stands for Quarterly and Annual.)

Tuesday, December 11, 2012

There are two kinds of people in the world: Those for whom everything revolves around inflation, and those who are not fools.


Kling: "In 2011, the Federal Reserve bought 77 percent of new debt issued by our government. We are already resorting to inflationary finance."

Fool.


Some people think a little more inflation would be a good thing. I don't. But I do think inflation is a useful and highly significant concept. Inflation helps me think about the economy. Sometimes I like to lay things out such that inflation is one of the possible outcomes, because sometimes inflation *is* one of the possible outcomes.

Often when I lay things out that way, I get a reaction I don't expect. People seem to object to the discussion of inflation. To me, that reaction is way off base. But after reading the post by Arnold Kling, I get where that reaction is coming from.

For Kling, for the readers for whom Kling is writing, inflation is the center of the universe. Everything revolves around inflation in the story Kling tells.

It is a story not worth reading.


For an alternative explanation of the Fed's purchase of government debt, please see my previous post.

Monday, December 10, 2012

Federal Debt Held By Federal Reserve Banks


F, D, H, B, F, R, B. It's easy to remember: Just look at the title of this post. FDHBFRB is the name of a FRED dataset.

There is another dataset too, with the same letters, plus an N at the end. N is for "new", I suppose, suggesting that the original set of capital letters represents a discontinued series. It does.

Here's what I looked at first:

Graph #1: Discontinued (blue) and New (red) Fed Holdings of Federal Debt, Relative to GDP
Fed Holdings (of Federal debt) relative to GDP. What's wrong with this picture?

Debt went up, that's what's wrong. Debt went up *way* more than GDP since the 1950s. GDP is a small denominator. GDP makes Federal Debt Held By Federal Reserve Banks look bigger than it is.

Here's a better measure:

Graph #2: Discontinued (blue) and New (red) Fed Holdings of Federal Debt, Relative to TCMDO
Fed Holdings relative to Total Credit Market Debt Owed.

By the standard of the 1950s and '60s, Fed Holdings since the 1990s should have been twice as high as they were. By that standard, Fed Holdings are low yet today. Even with that big spike there at the end.

Fed holding should be twice as high, or Total Credit Market Debt Owed should be half what it was since the 1990s. Or some combination of the two.

This is the Arthurian policy recommendation: more Fed holdings, and less credit market debt. Why? Because you can use credit for just about everything these days. But you can't use credit to pay off debt.

Sunday, December 9, 2012

What's wrong with economics?


I remained the whole day in seclusion, with full opportunity to occupy my attention with my own thoughts. Of these one of the very first that occurred to me was, that there is seldom so much perfection in works composed of many separate parts, upon which different hands had been employed, as in those completed by a single master.

Thus it is observable that the buildings which a single architect has planned and executed, are generally more elegant and commodious than those which several have attempted to improve, by making old walls serve for purposes for which they were not originally built.

Saturday, December 8, 2012

Model This


"Let's begin with the premise that everything you've done up to now is wrong."
- Sheldon Cooper


At Lars P Syll, Neoclassical economics – a theory based on shaky foundations. Syll quotes from Alan Kirman's What’s the use of economics?

we have to radically change the way we conceive of and model the economy.

They sure do. Unfortunately, that's easier said than done. The difficulty lies, not in the new ideas, but in escaping from the old ones, which ramify, for those brought up as most of us have been, into every corner of our minds.

A longer quote from Syll, from Kirman:
The typical attitude of economists is epitomised by Mario Draghi, President of the European Central Bank. Regarding the Eurozone crisis, he said:

“The first thing that came to mind was something that people said many years ago and then stopped saying it: The euro is like a bumblebee. This is a mystery of nature because it shouldn’t fly but instead it does. So the euro was a bumblebee that flew very well for several years. And now – and I think people ask ‘how come?’ – probably there was something in the atmosphere, in the air, that made the bumblebee fly. Now something must have changed in the air, and we know what after the financial crisis. The bumblebee would have to graduate to a real bee. And that’s what it’s doing” …

What Draghi is saying is that, according to our economic models, the Eurozone should not have flown. Entomologists (those who study insects) of old with more simple models came to the conclusion that bumble bees should not be able to fly. Their reaction was to later rethink their models in light of irrefutable evidence. Yet, the economist’s instinct is to attempt to modify reality in order to fit a model that has been built on longstanding theory.

Why are we talking about bees?

I was at another site earlier today, Thoughts on Economics. Robert Vienneau writes, "I study economics as a hobby." I thought that was funny, because I study the economy as a hobby.

When economists create models, they do things like Krugman does:


Does that really help you think? Reminds me of something I read, I know not where: "He explains English by way of Greek."


One more thing. I don't mean to be critical of Alan Kirman. After all, he did say "we have to radically change the way we conceive of and model the economy." I think Kirman is trying to see past all those ramifications in the corners of his mind. But in his opening, he says:

The simple question that was raised during a recent conference organised by Diane Coyle at the Bank of England was to what extent has - or should - the teaching of economics be modified in the light of the current economic crisis? The simple answer is that the economics profession is unlikely to change.

And in his closing, he says:

Does this mean that we should cease to teach ‘standard’ economic theory to our students? Surely not.

We have a long way to go, brother.

Friday, December 7, 2012

Reiterating...

Why did GDP growth falter?

The rising cost of interest, a result of our ever-increasing reliance on credit, drove up the financial cost of production. This cost drew income away from labor, causing a subtle decrease in the growth of demand. That same cost drew profit away from productive ("nonfinancial") enterprise, undermining the incentive for productive sector growth. And that same cost boosted the profit of the financial sector, enhancing the incentive for financial sector growth. Policy encouraged all of this, on the grounds that credit use is always good for growth.

GDP faltered because of our excessive reliance on credit.
From mine of 22 November.

Thursday, December 6, 2012

The Green One is Federal Debt


GREEN: The Federal debt
RED: Everybody else's debt
BLUE: Total Credit Market Debt Owed
See the problem?

Wednesday, December 5, 2012

Opportunity Knocks


Two views of Federal Debt relative to GDP:

Graph #1: The Gross Federal Debt, and Federal Debt not held by the Federal Government.
Click graph for FRED source page.
Don't ask me about the gap between the two lines, why it gets narrower or wider or anything like that. At the moment, I'm not thinking about the difference between the two lines. I'm thinking about the similarity. Yes, the one line is a little higher, and goes up and down at a different rate than the other line. That's true. But both lines show the same general shape. Very much the same shape.

Oh by the way, the higher line there, the red-and-green line is made from two different sets of numbers. The one starts in the early 1950s but ends before the year 2000. The other includes more recent values, but only goes back to 1966. To cover the maximum years, I put them both on the graph and, since they fall one atop the other, I call them one line.

So anyhow the early years show the blue and the red-and-green lines both falling until the 1974 recession, then a bit iffy until 1982, then working their way up until maybe 1993. Then they fall until the 2001 recession, are iffy again until the 2008 recession, and then go up again, faster this time. Both lines show the same repeating pattern. So I will refer to them now as "the blue line".

There are two zones where the blue line falls significantly: 1950-1974 and 1993-2001. Those are the only places where the downtrend is more than just a wiggle. We'll come back to this in a moment.

The sharpest uptrend appears at the last part of the blue line, in the years since the 2008 recession. In these recent years we have seen a severe recession (when GDP went down), a sluggish recovery (when GDP increased only slowly), and a large volume of Federal spending (trying to get GDP to grow more rapidly).

These two factors -- a rapid increase in the Federal debt, and little or no increase in GDP -- work together to push the Debt-to-GDP ratio up. That is the first point I want to make: The path the line takes is the result of two different numbers changing, each in its own way.

Down Trends


Table #1: Compound Annual Growth Rates
For the first two decades shown on the graph, economic growth was good. Incomes went up. Unemployment was down. And, Federal debt growth was well-contained. But it is the relation between the debt and the GDP that is key: For those two decades, GDP grew much faster than government debt.

For a few years in the 1990s, economic growth was good. Incomes went up and unemployment went down. And yes, deficits turned into surpluses. But it is the relation between the Federal debt and GDP that is important. Again, for those few years, GDP grew much faster than government debt.

I see a relation between the line falling on the graph, and times that the economy is good. I'm not alone in seeing this; I imagine everyone who calls for a reduction of the Federal debt and deficits sees the same thing. It's tricky, though. It only works when the blue line starts out relatively high.

Look at the first period on the graph, 1950-1974, the Golden Age. The blue line goes down and down and down. Soon it will run out of room to fall. But just before that happens, the economy goes bad: The blue line was too low.

And then we struggled with a so-so economy for 20 years. During that time the Federal debt increased, and the blue line worked its way back up again.

And then for a few years the blue line fell, and the economy was good again.

Okay? So what I'm saying is, if the Federal debt is low it cannot fall. But if the Federal debt is high, and then falls, the economy will be very good for at least a little while.

And the Federal debt is high, now.

Now... There is more to it than that. For one thing, we have not considered the level of private debt at all in this post. For another, the distribution of income created by all that Federal spending is massively important. But the fact that the blue line is now very high creates an opportunity. It should be easy now, to get the economy to grow.

It should be easy.

The great danger is that we will grow, but we will not take advantage of the chance to change a few policies. If we fail to change the policies we will get right back into the same mess again, only worse. But if we do make the necessary changes to our policies, we can stabilize the economy at a high level. We can surf the long wave.

Tuesday, December 4, 2012

Ditto, ditto, ditto


Steve Keen writes:
If you were told the following graph showed two indicators of Australia’s economic health, and one of them had to be addressed urgently, which one would you expect politicians and economists to try to bring under control first?


If you picked the blue line, you’ve obviously not a politician. The blue is the ratio of private debt to GDP in Australia; the red line is the ratio of government debt to GDP (debt to the banking sector only; both series come from RBA table D02). The red line is the one that both sides of politics in Canberra are obsessed about; the blue one they both ignore.

Not only in Canberra, I might add.

Monday, December 3, 2012

Beckworth: For every debtor there is creditor


In comments at his Money Still Matters post -- a title that cried out to me -- David Beckworth wrote:

For every debtor there is creditor, thus if debtors cut back on spending to deleverage then creditors should be receiving more funds with which they could provide an offset in spending.

Okay: For every debtor there is a creditor. But it might be only one creditor, for all the debtors. Or at the other extreme, everyone might lend to his neighbor and borrow an equal amount from the same neighbor. Or from a different neighbor maybe. Whatever. Lost in Beckworth's oversimplified assertion is any acknowledgement of concentration and distribution of wealth. But that is not the only thing he overlooks.

When debtors cut back on spending in order to pay down debt, funds come out of circulation and return to their owners. The recipients of those funds could spend them, as Beckworth asserts. But there is no guarantee of this. And as a rule, as a general tendency, those funds are *not* spent. As a rule, those funds remain with their owners, and move back into circulation again only by lending.

The level of debt is evidence of this. The Marginal Propensity to Consume is the operative law. By this law, money that falls out of the spending stream and lands in someone's savings, will tend to stay in savings. If it comes out, it comes out at interest and it comes out only on the expectation that it will return to the saver.

Someone with income sufficient to permit substantial savings to accumulate is unlikely to withdraw those savings and spend them. It is no great incentive to spend, that many people are paying down debt. Sure, prices may come down some. But the accumulator of savings is one person who does not need prices to fall before he can afford things.

If debtors cut back on spending to deleverage -- to delever, I think -- then creditors are receiving more funds and are unlikely to spend them. Certainly the creditors are unlikely to spend as much as the debtors cut their spending.

Beckworth's assertion is baseless.


Or you could look at it this way: Lending creates money, and paying down debt destroys money. So if debtors cut back on spending to delever, then for every dollar paid off, a dollar goes out of existence. The quantity of money goes down.

And if you look at it that way, there are no creditors "receiving more funds that could provide an offset in spending." Beckworth's assertion is baseless, again.


My understanding (if you could call it that) is that there are two kinds of debt. Debt that is created by banks that do the fractional reserve thing, and debt created by non-banks(??) that don't do fractional reserve.

If the lender does fractional reserve, the act of lending creates money, and the act of paying down debt destroys money.

If the lender doesn't do fractional reserve, it's like borrowing from your grandma. When you get the money, she doesn't have it any more. No money is created by this type of lending. This kind of lending is what Beckworth was talking about, grandmother lending.

Beckworth's assertion is baseless, either way.

Sunday, December 2, 2012

MPC: Adjusting the Focus


The architects of Reaganomics styled themselves Supply-Siders. They scorned the Demand-Side theories and policies they attributed to John Maynard Keynes and to his "liberal" followers...


J.M. Keynes, The General Theory, Chapter 24: Concluding Notes...:
...we have seen that, up to the point where full employment prevails, the growth of capital depends not at all on a low propensity to consume but is, on the contrary, held back by it; and only in conditions of full employment is a low propensity to consume conducive to the growth of capital.

It is not the ownership of the instruments of production which it is important for the State to assume. If the State is able to determine the aggregate amount of resources devoted to augmenting the instruments and the basic rate of reward to those who own them, it will have accomplished all that is necessary.

In the above excerpt, we see that Keynes favors a higher propensity to consume (he wants to increase aggregate demand) but says something confusing about investment.

But in the noontime post we saw Keynes call for increased investment -- "investment sufficient to absorb the excess", the income that people want to save:

...employers would make a loss if the whole of the increased employment were to be devoted to satisfying the increased demand for immediate consumption. Thus, to justify any given amount of employment there must be an amount of current investment sufficient to absorb the excess of total output over what the community chooses to consume...

Keynes favored increasing demand and increasing supply.


When you increase the propensity to consume, you reduce the propensity to save. Instead of going into savings, the money stays in the spending stream.

When you increase the inducement to invest, you make sure the money that *did* go into savings gets borrowed and put back into the spending stream.

Keynes' concern was neither the supply side nor the demand side. His concern was that too much money goes into savings, and has no reason to come out.


If there is no spending, there is no economy.

MPC: The outline of our theory


J.M. Keynes, The General Theory, Chapter 3: The Principle of Effective Demand:
The outline of our theory can be expressed as follows. When employment increases aggregate real income is increased. The psychology of the community is such that when aggregate real income is increased aggregate consumption is increased, but not by so much as income. Hence employers would make a loss if the whole of the increased employment were to be devoted to satisfying the increased demand for immediate consumption. Thus, to justify any given amount of employment there must be an amount of current investment sufficient to absorb the excess of total output over what the community chooses to consume when employment is at the given level. For unless there is this amount of investment, the receipts of the entrepreneurs will be less than is required to induce them to offer the given amount of employment. It follows, therefore, that, given what we shall call the community’s propensity to consume, the equilibrium level of employment, i.e. the level at which there is no inducement to employers as a whole either to expand or to contract employment, will depend on the amount of current investment.

"Our" theory. I like that.

29 seconds


MPC: Marginal Propensity to Consume


From the Wikipedia article:

The proportion of the disposable income which individuals desire to spend on consumption is known as propensity to consume. MPC is the proportion of additional income that an individual desires to consume.

Oh... Okay. But that is not the interesting thing about the MPC. The interesting thing is that as income goes up, more of it gets saved. Saving increases faster than income, and spending increases more slowly. The propensity to save goes up more than income. The propensity to consume goes up less.

And that is exactly what Waliapreeti's graph in the Wikipedia article shows:

Graph #1: Consumption Spending goes up Less than DisposableIncome.

As income goes up, more of it is saved. As income goes down, less of it is saved. If we are saving less, the MPC says, our income is probably going down.

So now: Here's a graph of the U.S. personal saving rate. (As FRED describes it, "Personal saving as a percentage of disposable personal income".)

Graph #2: Personal Saving as a percentage of Disposable Personal Income
A pretty much straight-line decline in saving from the mid-1970s to the recession of 2009. The MPC tells us what we already know: Income was going down all that time.

But then, with the recession of 2009, the saving rate suddenly jumped up. So based on the principle of the Marginal Propensity to Consume, did income suddenly jump up sharply? That upward spike during the 2009 recession, that's what it suggests.

Or maybe -- just maybe -- there was a sudden change in the Marginal Propensity to Consume. Yeah, that's it. A sudden change in the MPC. And what does that tell us?

It tells us that the straight-line downward trend of saving and income was not a sustainable policy.

Saturday, December 1, 2012

Embarassingly Bad Arithmetic

Happy birthday, Dad.

I have many times criticized Milton Friedman's work as bad arithmetic. Friedman's famous graphs show that inflation follows a path unbelievably similar to his "money relative to output" ratio. This ratio is the problem.

The "output" in Friedman's ratio is the value of output after adjusting for inflation.

Inflation is removed from the denominator of Friedman's ratio. This arithmetic is identical to multiplying inflation into the result. Friedman's famous ratio shows a similarity to inflation because he multiplies inflation into his result. It is just bad arithmetic.

Economists seem to think Friedman's graphs are good evidence. I am telling you I don't care how good Friedman's economics is; simple arithmetic shows that his graphs are no better than a hoax.

But Friedman is not the only economist who cannot do math. The world is full of 'em, it seems. Recently I have been dwelling on the oft repeated thought that Federal spending growth is bad for economic growth.

But "bad economic growth" is measured as a slow rate of increase in GDP. And Federal spending is measured by comparison to GDP. So when GDP increases slowly, it makes Federal spending seem to increase rapidly.

The ratio "Federal spending relative to GDP" makes Federal spending appear to be increasing rapidly because GDP is increasing slowly. You might deny the causality that I here emphasize. But think about it: What do we know for sure? We know for sure that GDP growth is slow.

Everything else is just embarrassingly bad, agenda-driven arithmetic.