On my desktop, a shortcut title catches my eye: 2% Real Per-Capita GDP Growth A Long-Term Trend We Can Count On - Seeking Alpha.
The link opens a page on Seeking Alpha, by Mark J. Perry. Here's a bit:
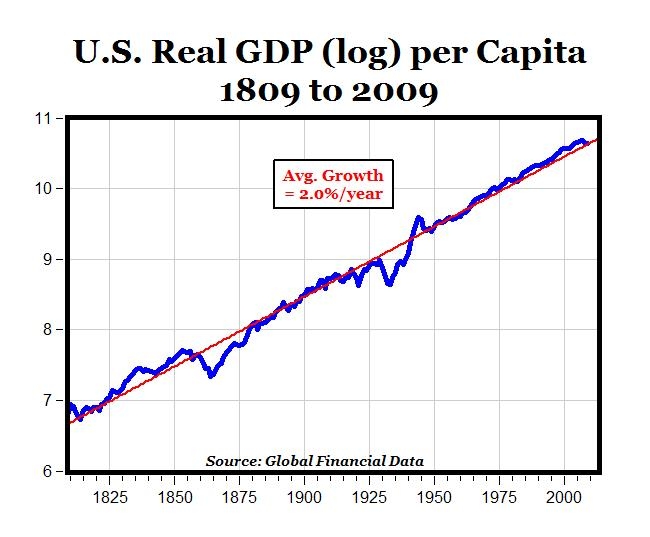
Over the last 200 years, going back to 1809, the chart above shows that the growth in real GDP per capita in the U.S. has been amazingly constant at an average of 2% year, with fluctuations around that long-term secular trend.
Now I have to say, I have never come across a Mark J. Perry post that I thought was any good at all. But I don't go looking for Perry garbage. I trip over it. As you know, I'm fascinated by graphs and by GDP growth. I left that link on my desktop a while back because it looked interesting.
Ha.
I tried to duplicate the graph. It's a joke. Perry says the growth works out to 2% per year. But it's only about 1.75%.
When it comes to long-term growth rates, 1.75% is not even close to 2%. After 200 years, 1.75% growth produces a 32-fold increase. 2.0% growth produces a 52-fold increase. There's no comparison.
It could be a rounding error -- but it can't be a rounding error, because they don't call it two percent. They call it two point oh percent. 2.0% means the number before rounding was between 1.95 and 2.049 or so. 1.75% would round to 1.8%, not 2.0%
So, it's bullshit.
 |
| Graph #2: Real GDP per Capita (blue) and 2% Growth (red) (Not on a Log Scale) |

U.S. Real GDP per Capita data from Measuringworth: Louis Johnston and Samuel H. Williamson, 'What Was the U.S. GDP Then?' MeasuringWorth, 2012.
I put the data into a Google Docs spreadsheet on Google Drive. (Is that the proper way to say that?). On the Tweak the Trend sheet you can change the numbers in the yellow cells -- the starting value, and the growth rate -- to change the trend line on the graph. See if you can duplicate Mark J. Perry's graph using 2.0% growth. I dare ya!
(Note: I "shared" the file and clicked the setting so you can "edit" it. Please change only the numbers in the yellow cells on the "Tweak the Trend" sheet. Or make yourself a copy of the file to modify as you will.)
I took another look at the RGDP PC numbers in an Open Office spreadsheet. You can download it at the link.
And here's a link to a help page on Calculating Geometric Growth:
http://arnoldkling.com/econ/GMU/growthArith.htm
I used the notes on "Solving for Average Growth" for the "Kling Calc" in both spreadsheets.
New since I was last at Measuringworth: There is now an option to download your selected data as a CSV file for import to a spreadsheet. Nice! But I imported it carelessly into the Open Office sheet, and the numbers came in as text and had to be tweaked. (I just used the =VALUE() function on them.)

2 comments:
Saw this and thought you would be interested (assuming you have not seen it before). Maybe a new thread for you---18th Century monetary policy. :)
http://www.macrofugue.com/the-paper-by-which-ben-franklin-invented-monetarism-liquidity-preference-reits-and-labour-economics/
I can't believe I read the whole thing :)
That's a great piece of writing. But with phrases like "medium of exchange" and ideas comparable to the natural rate of interest, I was starting to think the guy wrote it in the style of old Ben Franklin. I had to Google the title of BFs piece and look at a few of the results before I could bring myself to say Wow!!!
That's a nice site, Macrofugue.
Actually... I've read Adam Smith and Alexander Hamilton in support of paper money. Now here's Franklin several decades earlier. This is a great link! Thanks Gene.
Post a Comment