The first part of yesterday's graph:
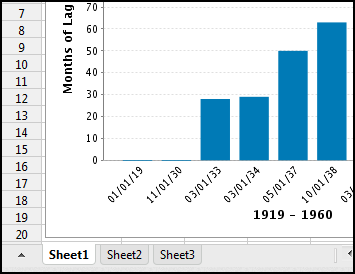
The first two readings are zero. Then it jumps up. But by the second reading, the Great Depression was already a year old. It doesn't seem right that the lag was still zero -- not if the lag was a result of the Depression, surely.
Here's the thing. I can only measure lags by looking for similar changes that occur in both the data series I'm looking at. I look for turning points, highs and lows, peaks and dips. And I look for relative size. Big peaks in one series go with big peaks in the other, small peaks go with small ones. It's not rocket science.
In the opening years of the "Tedium" graph we've got a big dip that bottoms out around 1921. The red and black versions of that dip start together, bottom out together, and end together. Oh, maybe the turning points are a year apart. But that's nothing.
 |
| Graph #1: No Lag |
But anyway, after that big "vee" that bottoms out and rises again, the red and black lines run downhill together from the early 1920s to the separation that occurs in 1930. There are some small ups-and-downs in that downhill run. And I suppose you could argue that the first two small black peaks lead the first two small red peaks by a year or so. I guess you could say the lag is a year at that point, then.
Even so, follow the downhill run until the yellow highlighting runs out, and there's not much else to go on. There's not much else to be said about what's leading, or what's lagging, or by how much. So at that point, at the end of the yellow highlight, I called the lag zero. And that's what shows up second vertical bar on my bar graph.
Then we get into the 1930s and the red line falls while the black line rises. Only after a delay of more than two years does the red line rise, finally mimicking the black. By that point, a lag has definitely opened up.
You know, when I thought to write this post, I wanted to say the lag was probably developing during that downhill run in the 1920s. But looking at the graph, I just don't see it.
I still don't like that second reading, but I stand by it.

No comments:
Post a Comment