Monday, August 8, 2011

Krugman Industrial Smoothing


"According to our latest quarterly thing, Kruger Industrial Smoothing is heading into the red. Or the black, or whatever the bad one is. Any thoughts?"

Paul Krugman writes in Minus 512, 2.4 Percent:

Policy makers have been worrying about the wrong things, obsessing over deficits when the real problem was lack of growth.

In The Arithmetic of Near-term Deficits and Debt he argues that the arithmetic says

the size of the deficit in the next year or two hardly matters for the US fiscal position — and in fact the size over the next decade is barely significant.

In defense of this hardly matters view, "Kruger" makes these points:

1. What matters is the real interest rate, and the real interest rate is low.

2. The estimate for "potential real GDP in 2021" is high enough that "an extra trillion in borrowing adds something like 0.07% of GDP in future debt service costs."

In other words, adding a trillion dollars to the Federal debt won't cost us very much. This is Krugman's argument.

So let me ask: Do you think Kruger's argument can win the hearts and minds of the Tea Party? of the Undecided?? of anyone not already Inclined to agree with him???

I don't.

First of all, he's playing with the numbers, talking about "real" debt versus "nominal" debt. (I didn't quote that part. I don't think it's valid. Debt is always in current dollars.)

Second, Krugman says adding to the debt won't cost us very much. But everybody and his brother -- liberals included -- all think the Federal debt is the reason our economy refuses to grow. It isn't. But people think it is. So nobody wants the Federal debt to go up. Not even a little. Krugman's argument will not fly.

Third, he's talking about "real potential GDP" ten years out. But even if, ten years from now, we still have the same estimate of "real potential GDP," there is no guarantee we'll actually achieve that best-case outcome. Little chance we will live up to our potential.

Krugman's argument is industrial-grade smoothing.


Remember, Krugman says "the real problem" is lack of growth.

What does he propose to do about it? Increase the Federal debt, because it won't cost us very much. But we've been increasing the Federal debt relentlessly -- since Reagan or before -- and it has not solved the problem of inadequate growth. So nobody thinks increasing the Federal debt more will solve that problem. And they're right.

But reducing Non-Federal debt will solve the growth problem. And you know what? People want to reduce their own debt. So they might even like that plan.

Sunday, August 7, 2011

One sentence from Beckworth


Several studies that examine economic conditions since 1970 or since 1980 pile error upon error. They fail to compare conditions to those of a healthy economy. This leads to false conclusions. In addition, these studies examine government debt exclusively, failing to consider the greater burden on the private sector that is the debt of the private sector.

To see why Jazz was all riled up, I had to read this Beckworth post, then Beckworth's link at Cafe Hayek, and finally Hayek's internal link.

In all of that, one sentence from Beckworth stood out:

What the evidence does show is that in most cases where fiscal consolidation was accompanied by a robust recovery it happened because monetary policy was accommodative.

That idea is central to the post, titled "Fiscal Austerity Requires Monetary Liberality". From the central notion, Beckworth draws general conclusions:

Along these lines, a more general point is that the impact of any fiscal policy action--where expansionary or contractionary--depends on the stance of monetary policy... Another way of saying this is that an independent monetary policy will always dominate fiscal policy.

And from those conclusions Beckworth draws policy implications:

So if Russ Roberts is like me and wants fiscal policy consolidation that works he should really be clamoring for more monetary stimulus. Otherwise he may get more than he bargained for.

I don't think I agree with much of that. But the central notion is key.


That notion again:

...in most cases where fiscal consolidation was accompanied by a robust recovery it happened because monetary policy was accommodative.

When I read it, it created a picture in my mind. Perhaps I can re-create the picture:

"Robust recovery" requires vigorous spending growth. Commensurate with the growth of spending, I expect to see a vigorous growth of the medium of exchange: a vigorous growth of money in circulation.

"Fiscal consolidation" spends less money into circulation. This is not conducive to a vigorous growth of money.

"Accommodative" monetary policy is conducive to vigorous money growth. So it is not surprising that Beckworth's evidence shows accommodative money growth accompanying robust recovery when fiscal expansion does not.

But there is a big difference between fiscal expansion and monetary accommodation. Fiscal expansion increases debt in the public sector. Monetary expansion increases debt in the private sector. Get the picture?
Beckworth overlooks it, in his post.
The relation between the two debts can be observed in my debt-relative graphs.


It takes a lot of time to read other people's evidence. But I'll give it a shot.

Beckworth links to Chapter 3: Will it Hurt? Macroeconomic Effects of Fiscal Consolidation from the IMF, a 32-page PDF. A quick scan of the paper turns up the following note:

Looking at History: What Is the Short-Term Impact of Fiscal Consolidation?

In this section, we examine the history of fiscal retrenchment in advanced economies over the past 30 years and evaluate the short-term effects on economic activity. The section starts by explaining how we identify periods of fiscal consolidation, and contrasts our approach to the standard approach used in previous studies. It then reports the estimated effects of fiscal consolidation, and compares our results with those based on the standard approach.

That's all very nice, and you probably didn't even notice, but this thing they call "history" looks only at the past 30 years. That takes us back to around 1980, six years after the 1974 recession, by which time it was already obvious that the economy was no longer in good shape. So this IMF study is yet another study of a completely screwed-up economy, with no "golden-age" years to serve as a benchmark.


Beckworth links next to G-24 Policy Brief No. 57, "Fiscal consolidation, growth and employment: What do we know?" a 3-page PDF.

An IMF study of 74 cases of fiscal consolidation in 20 industrialized countries over the 1970-1995 period concluded that 14 cases were ‘successful’ in the sense that they were marked by sustainable reduction (by about three percentage points over a period of three years) in the debt-to-GDP ratio as well as an increase in growth and employment creation. Second, Alesina and Ardagna study of 107 episodes of fiscal consolidation in all OECD countries in the 1970-2007, found 27 cases of fiscal consolidation with growth. Thus, the probability of a successful fiscal consolidation may be between 19% (as in the IMF study) and 25% (as in the Alesina-Ardagna study).

Even if fiscal consolidation programmes have a reasonable chance of being accompanied by growth and employment creation, the latter cannot be attributed to budgetary austerity. Often, enabling factors more important than fiscal actions are at work, including: (1) the influence of the global business cycle, (2) monetary policy, (3) exchange rate policy, and (4) structural reforms.

Again, most of these 74 cases and 107 episodes occur after 1974, when it was exceedingly obvious that the economy was no longer in good shape. And all of then occur during or after 1970, when the economy was in fact no longer in good shape.

I like this paper's recognition that there are always other factors at work.

This PDF is short, and definitely worth the read.


Beckworth's third link brings up The Boom Not The Slump: The Right Time For Austerity, an 8-page PDF. This paper is a review of Alberto F. Alesina and Silvia Ardagna's 2009 paper, “Large Changes in Fiscal Policy: Taxes Versus Spending”. That is one of the papers also considered at Beckworth's second link. Again, the study considers only conditions since 1970 when the economy was already in trouble.

The paper's conclusion:

We are living in extraordinary times. This is the largest recession since the Great Depression. A large part of the rest of the world is also undergoing a sharp downturn. There is a genuine and reasonable concern that public intervention will replace the private debt overload with a sovereign debt overload. As such, sound policy advice requires that we recognize what historical examples are relevant for our current situation.

The A & A data do not appear to provide much solace in this regard. Their examples of successful consolidation are typically conditional on cutting a deficit during a boom and not during a slump. There may be situations in which consolidation does indeed result in better outcomes, but those do not apply to the U.S. at the moment. It is not clear that immediate fiscal consolidation will do much to alleviate that worry. Without robust growth, there is little hope of the debt-to-GDP ratio falling. The hope in undertaking such steps is for private investment to be reignited by increased trust and faith in the viability of government finances. While this may be a reasonable hope in some situations, the prospects for such a revival in the U.S. appear bleak.

Without robust growth, there is little hope.


These studies, and the studies they examine, consider events occurring during our time of troubles. If we want to escape from the troubles and from the crisis that came of them, we would do well to contrast troubled times to times of robust growth.

In addition, the studies consider public debt, which is not the debt that caused our troubles. If we want to achieve robust growth, we must not ignore private debt.

I examine the brief "macroeconomic miracle" of 1995-2000 in The Rise and Fall of the Non-Federal Relative. In that post I show that the short period of robust growth was indeed associated with accommodative monetary policy. I also show it associated with a fall in private debt relative to public debt. In other words, growth follows from the reduction of private debt. Not from the reduction of public debt.

The same trends -- a relative fall of private debt, and monetary expansion -- appear during the FDR years, and again in our time, since 2008.

After a period when private debt is reduced (relative to public debt), accommodative monetary policy encourages the renewed growth of private debt, and this leads to renewed economic growth. Such growth happened between 1947 and 1973. It happened between 1995 and 2000. And it will happen at some point in our future, unless we blow it. But when will it happen? That depends on the wisdom and folly of policymakers.

There are those who would reduce the private debt ratio by increasing the public debt. This can work, but only if private debt growth is somehow held back until the ratio has fallen. But it is inflationary.

There are those who would reduce the private debt ratio by allowing the economy to collapse. This can work also, and this is the way we are headed I think, but it will not be pretty. And it is deflationary.

It seems to me there is a middle ground, where to reduce the private debt ratio we reduce private debt by printing money and using that money to pay off debt. When you pay off debt, the debt ceases to exist, and so does the money you use to pay it. If the newly printed money ceases to exist, it cannot be inflationary. And if we manage in this way to avoid collapsing the economy, it will not be deflationary.

Without robust growth, there is little hope.

Saturday, August 6, 2011

Headline: "US Credit Rating Downgraded 1 Notch"


...by leaders of the financial industry, the same financial industry that needed U.S. government help three years back. And how did the government help? It took upon itself much of the risk of debt held by the financial sector, so that finance would not fail. The government took that "toxic" debt upon itself.

This is the financial industry's way of saying "thank you"? Tax the bastards.

I read this once, somewhere: After World War II, Germany imposed "a one-time wealth tax." It was a way to correct imbalances in the economy.

We could do that.

Today, I'd even make it punitive.

The Best of Mosler


Not that I''ve read much, but this is absolutely the best I've read from Warren Mosler:

Why there is a deficit
Posted by WARREN MOSLER on July 26th, 2011

The main reason we have a large budget deficit is because of all the tax advantaged savings plans- pension funds, IRA’s, insurance and corporate reserve.

All of these financial assets, which compound continuously, represent unspent income.

And unless they are offset by some other agent spending that much more than his income, the dollars won’t be there to be saved in these tax advantaged entities.

Pension plans, IRAs, insurance and corporate reserve. Tax-advantaged savings plans. Encouragements to save. Encouragements to remove money from circulation.
(But I don't think they compound "continuously". That's a technical term.)
To live life as we know it, we need money and we need it circulating. That's how we shop, and how we eat, and how we buy our toys, and how we get paid.

Never thought about that? When you receive your paycheck, money is circulating.

If not enough money circulates to us, sometimes we borrow a little. We are, each of us, little versions of the Federal Reserve, creating money by spending it into circulation.

But we do it by borrowing and spending it into circulation. So does the government, actually. Only the Federal Reserve doesn't have to borrow before it puts money into circulation. Apparently, however, the Fed is allowed to circulate it only to people who already have money. Unfortunately, that doesn't fix any problems.

So anyway, with all these tax-advantaged encouragements to save, we lost circulating money and gained sedentary money. Then, to continue living life as we know it, we increased our borrowing and made up for the shortfall that way.

And wasn't it convenient -- There was plenty of sedentary money just waiting to be borrowed.


If you stop and think about it, you might notice that the problem, really, was caused by tax-advantaged encouragements. In other words, the problem was created by Congress. The Federal Reserve, poor bastards, take the blame while Congress points the finger. But most of the problem lies with Congress. And they ought not be allowed to get away with it.

The long and short of it is this: There is an imbalance in the money. An imbalance between circulating money and sedentary money. An imbalance between the quantity of money we receive as income and the quantity we have to pay interest to use. An imbalance between low-cost money and high-cost money. There is an excess of interest cost relative to the amount of spending we do. This is the central problem.

In the process of creating all those tax advantaged savings plans that Warren writes about, we also created a shortage of circulating money and an excess of money in savings. So we have to pay interest to use the money. That extra cost is killing us.


Note that in five lines of text, Warren manages to use the words "tax advantaged" twice. You might take that as a clue as to what the solution requires.

Friday, August 5, 2011

Playing with output


Below is a FRED graph showing the FEDFUNDS interest rate (blue) and the "percent change from year ago" of GDP. These are the same time series used by Rodger Mitchell, as noted in my two previous posts.

By moving the mouse onto the graph, you change the red GDP line to "real" or inflation-adjusted GDP. By moving the mouse off the graph, the line changes back to show nominal GDP again.


Having had a chance to compare both "real" and "nominal" output to the Federal Funds rate via the hover mechanism, I should say that the overall trend of the red line is shaped by inflation into a pattern quite similar to that of the interest rate. But the individual ups and downs that concern Rodger in his post are not so much affected. That is, the "ups" for the most part remain "ups" and the "downs" remain "downs". So, while he uses bad numbers, that choice probably does not affect his argument.


Clearly, Rodger's graph looks different after 1984 than it appears before. Yet, looking again at the graph for the years after 1984, I note that the blue line tends to rise until the red line starts to fall, and then the blue line rises a bit more before itself beginning to fall. This is the same pattern that occurs before 1984: Rising interest rates tend to slow the increase of growth, and lead to recessions.

This pattern occurs around 1984, and again around 1988, and again around 1995, and again around 2000, and again around 2007. Each time, the rising blue interest rate line continues to rise while the rising or flat red line showing GDP turns and starts to fall. Each time, interest rates rise until growth slows down, and often there is recession.

Rising rates reduce growth at lower and lower levels in the years since 1984. This is part of the reason the graph looks different in these years. Nevertheless, falling interest rates still induce growth, and rising rates still hinder growth.


The Growth of Real GDP

In the years before 1984, growth very often achieved moments at or above a 7½% rate. In the years after 1984, growth never managed to reach even 5% except during the "macroeconomic miracle" of the late 1990s. This is the reason the graph looks different in the more recent period. It is not that high interest rates no longer hinder growth. The problem more accurately is that low interest rates do not result in the kind of growth they formerly did. (And this, I think, explains why policy allowed interest rates to fall since the early 1980s: It was an effort to obtain growth.)
It likely also explains why Rodger writes: "The history of Fed rate cuts, as a way to stimulate the economy, is not a good one."
Nonetheless, low interest rates do encourage growth and high interest rates hinder it, not only before 1984 but after as well. I cannot accept Rodger's claim that this pattern does not hold.

The difference, the reduction of peak growth since 1984, is a result of our greater reliance on credit and on the cumulative cost of that change.

Thursday, August 4, 2011

The Interest Rate and GDP Growth (follow-up)


Yesterday, I looked at Rodger Mitchell's "The low interest rate/GDP growth fallacy", wrapping up my criticism with a look at his FRED graph:

Graph #1: Rodger's graph

Of this graph, Rodger said:

Not only are low interest rates not associated with high economic growth, but to a slight degree the opposite seems to be true. There seems to be a small correlation between high interest rates and high GDP growth.

Rodger is not specific about the correlation he reports. But that's okay; I expect to agree with him on this point. Be patient with me while I get there.


In the previous post I said, "Rodger's graph begins in 1971, which is just about the end of the good years of the post-WWII period. So, Rodger's graph is a study mostly of the bad years."

I said, "I looked at what FRED has on this. Rodger could have taken the graph back to 1954. I'm thinking, if the good years supported his argument he would have shown them. But he didn't show them."

I said, one can clearly see on Rodger's graph that high interest rates *did* inhibit growth, "creating the recessions of 1974 and 1980 and 1982."

In sum, I suspect that from 1954 to 1984, Rodger's graph would contradict Rodger's claims; and that after 1984 the graph behaves in a way that does not contradict him.


All through my earlier post, the running theme was that the economy changed because our reliance on credit increased:

The economy's response to interest rate cuts has changed because our use of credit is vastly greater... [If] monetary policy doesn't work as well as it once did, there are reasons for that... In an economy that uses credit for everything, changing interest costs affect everything.

So without really getting into Rodger's graph, I found that what he said of it might be true only of years after 1984, and seemed not to be true of the earlier years. And I offered an explanation for the change: the increasing reliance on credit.

Now, we shall get into Rodger's graph. I reconstructed it at FRED. But I used inflation-adjusted GDP rather than Rodger's nominal, to get a more accurate picture of growth. And I start with the early years:

Graph #2: 1954-1984

The vertical gray bars indicate recessions.

The four right-most gray bars indicate the recessions of 1970, 1974, 1980, and 1982. It is quite easy to see the blue line (the interest rate) increasing on the approach to all four of these recessions. At the same time, in each case, as the interest rate increases, GDP growth (the red line) falls.

Despite what Rodger says, increasing (or, "high") interest rates clearly had a negative effect on growth in the 1969-1984 period.

But with Graph #2 I couldn't get a good look at the early years, before 1969. So I cropped the graph, cutting off the years after 1974, to get an enlarged view of the earlier period. In addition, I gave each trend-line its own vertical axis, to let each one better fit the whitespace of the graph:

Graph #3: 1954-1974

The interest rate (the blue line) increases from 1954 to 1958. At first, GDP growth (the red line) is not restrained. But after it rises above 7.5% (left-hand axis) GDP growth falls, and then falls again with the onset of recession. Rising interest rates caused, or correlate with, a slowdown of growth.

During the recession, interest rates are allowed to fall until growth resumes.

After the 1957 recession, the pattern repeats: Interest rates rise from 1958 to 1960. During that period, GDP growth increases, peaks, and finally falls. The fall of growth continues into the 1961 recession. Again, rising interest rates cause or correlate with a slowdown of growth.

During the recession, interest rates again ease until growth again resumes.

After the 1960 recession, the pattern repeats again. From a low of 2.0 (right-hand axis) interest rates gradually rise to over 8 percent by 1970. During that decade growth rises, then varies at a high level. But interest rates continue to rise, and by 1970 the economy falls into recession.

Again during the 1970 recession, interest rates fall until the recession ends and growth resumes.

A detail from that decade: Around 1966 interest rates rose sharply for a year. At the same time, we saw a sharp drop in growth. (This is the "near-recession" that I sometimes mention.) But before 1968 interest rates fell, and then held steady, and the economy did not fall into recession.

Rowland Evans and Robert D. Novak described this detail in the July 1971 issue of Atlantic Monthly:

Having choked off the money supply as an anti-inflation device in 1966 so tightly that it produced a serious slump in housing and construction (called by some a "mini-recession"), the central bank started pouring out money too quickly and too generously in 1967 and thereby spoon-fed a new inflation.

By 1968, interest rates were rising again, slowing GDP growth and leading to the recession of 1970.

We looked at the years after 1970 in the discussion of Graph #2 above. But Graph #3 makes it evident that after the 1970 recession interest rates stayed low for a couple years while GDP growth again rose rapidly. Then interest rates started rising, GDP growth peaked, and the economy again fell into recession.

The pattern is consistent: Low interest rates allow growth to increase. Rising interest rates eventually cause a slowdown of growth. Beginning in 1954 and continuing for 30 years, Graphs #2 and #3 show that low or reduced interest rates encourage growth, while high or rising rates hinder growth.

Rodger says, "there is no historical correlation between interest rates and economic growth." Rodger is wrong. The correlation *is* historical.


We look next at the years since 1984:

Graph #4: 1984-2011
Rodger says there "seems to be a small correlation between high interest rates and high GDP growth."

"How can this be?" he asks.

"When interest rates are high," Rodger says, "the federal government pays more interest on T-securities, which pumps more money into the economy. This additional money stimulates the economy." In other words, we have come to rely on interest income, as opposed to income from wages and profits.

As for myself, I think his explanation is probably true but not significant. It plays a minor role. There are other factors of greater weight. But I do find it interesting that Rodger's explanation depends upon the concept of a growing reliance on credit.


Rodger's analysis begins with a bad argument about inflation and recession being opposites. He reinforces his analysis by relying on the absurd notion that interest is never compounded, that it is always withdrawn and spent into circulation. And he rounds out his argument by asserting the thing he is trying to prove -- that "there is no historical correlation between interest rates and economic growth."

Finally, Rodger presents a graph of GDP growth and claims that it supports what he has been saying. But the graph does not even show GDP growth. It shows percent change in inflating GDP. Growth cannot be measured while inflation skews the numbers.

My argument is that the economy changed, and that the change is visible in the two different behaviors of the graphs we have reviewed: before 1984, and after 1984.

Rodger's argument is that inflation and recession are not opposites; and therefore monetary policy cannot work. He neglects the fact that it worked like clockwork for the 30 years from 1954 to 1984.

Let it be enough, for now, that Rodger and I agree on this: Since some time around 1984, monetary policy has not worked as well as once it did.

In fact I should prefer to say that raising and lowering interest rates DID make sense in the 1950s and 1960s. It does not make sense any more, or at least it does not *work* any more, because the economy has changed since those days: We use far more credit now than we did then, per dollar of spending. And because our use of credit is vastly greater, the influence of changing interest rates is vastly greater.

Wednesday, August 3, 2011

"The low interest rate/GDP growth fallacy"


You know the economy is a mess. Everybody knows. What does it mean?

It means the people making the policies and the people that give them guidance are wrong. That's what it means. And how did they get to be wrong? Well, there are two stories about this. I'll tell the short story first:

Keynes died.

End of story. Samuelson and the rest of 'em came along then, and started making things up and calling them Keynesian things. But they were not Keynesian things. They were Samuelsonian things, and like that. The economy was in a golden age in those years after Keynes died, the years after World War II, and no matter what Samuelson and the rest of them did, it worked. It wasn't that they were good. They were just lucky.

After a while their luck ran out, because the magic dissipated, whatever magic it was that had created a golden age. So then, there started to be bad consequences from the things they were doing and the things they had done. Frankly, they did not know what to do. They threw their hands up, and puzzled it.

Which brings us to the second story.

It happened the same way mythology and fables developed: People like Lucas and them started telling each other stories. The good stories, they repeated. The bad stories, they forgot. They repeated the good stories and expanded upon them, and more storytellers joined in the tell. And they called the story DSGE and they kept telling it right up to the moment that the economy went into depression. They keep telling it, even now.

That's the end of the second story.

"Meme". I think that's the word. It's like a virus in society, or in a group like a group of economists, say. And all you need is one wrong phrase in the right place, and nobody notices, and the story grows and becomes like a Bible, and people just accept it, and nobody even notices the parts that are wrong.

Keynes said, "It is astonishing what foolish things one can temporarily believe if one thinks too long alone." It is true, to be sure. But it is equally true that one may think foolish things because one thinks too much in the company of others, and the meme spreads like measles, spreads like the plague.

I spend a lot of time being wrong, and I'm slow-moving. It can't be helped. But I do my best to avoid repeating clever phrases other people come up with. I won't use an idea unless I understand it my own way, see that it is right, and have it in my own words.


The title of this post is taken from the post I'm evaluating, from Rodger Malcolm Mitchell's place. Rodger has a whole long list of "Ideas You May Enjoy" and this one fascinated me. The title fascinated me. The post, not so much.

Rodger, I should say up front, I don't want to be mean. I'll try to offer constructive criticism. But I think you're telling stories, Rodger, bad stories. I think you're trying to create memes like Lucas did, false notions well told that catch on and spread. And I won't have it, Rodger. I won't have it.

You don't want to be responsible for the sort of embedded errors that Lucas is responsible for, do you Rodger? I hope not. But your work is full of errors.


So, the post. Rodger writes:

The Fed raises interest rates to fight inflation. To fight recession, the Fed does the opposite. It cuts interest rates.

This may sound logical except for one, very small detail. The opposite of inflation is not recession. The opposite of inflation is deflation. So doing the opposite of what you would do to counter inflation makes no sense when trying to counter a recession.

One of the things that messed up Samuelson and them, in the 1960s, was the Phillips Curve. Economists at the wheel at the time described a tradeoff between inflation and unemployment, a tradeoff that was disputed by other economists riding shotgun. And when, in the 1970s, we ended up with high inflation and high unemployment *both* (rather than one high and the other low) there was a Chinese fire drill and a change of drivers. Lucas took the wheel.

But it is not a question of whether inflation and recession are opposites. Rodger Malcolm Mitchell misunderstands the simplest thing. He leaves out spending.

Inflation is associated with "too much" spending. Recession is associated with "too little" spending. The Fed raises or lowers interest rates to influence the level of spending, to guide the economy on a "best path" between inflation and recession.

If you must reduce the logic to "opposites," Rodger, too much spending and too little spending are opposites. Therefore, raising interest rates or "doing the opposite" does make sense.

In fact I should prefer to say that raising and lowering interest rates DID make sense in the 1950s and 1960s. It does not make sense any more, or at least it does not *work* any more, because the economy has changed since those days: We use far more credit now than we did then, per dollar of spending. And because our use of credit is vastly greater, the influence of changing interest rates is vastly greater.

In an economy that uses credit for growth, changing interest costs affect growth. In an economy that uses credit for everything, changing interest costs affect everything.

In an economy that uses credit for growth, changing interest costs affect growth. In an economy that uses credit for everything, changing interest costs affect everything.

Rodger writes:

The history of Fed rate cuts, as a way to stimulate the economy, is not a good one.

The economy's response to interest rate cuts has changed because our use of credit is vastly greater. If interest rates now were half what they were then, but our reliance on credit had doubled, there would be no reduction of aggregate interest cost. In fact, as long as people still held loans issued at older, higher interest rates, total interest costs would be higher now, despite the low rates.

And that does not even begin to consider the downpressure on the quantity of money resulting from the repayment of all that principal. Nor does it consider the reduction of discretionary income remaining after the loan payments are made. Nor does it consider that a change in interest rates today affects not only the decision to expand the business, but also the cost of borrowing to meet payroll.

So, Rodger, if monetary policy doesn't work as well as it once did, there are reasons for that. But there is *no* sweeping generalization to be made, that (as you say) "doing the opposite of what you would do to counter inflation makes no sense when trying to counter a recession". That is a bad meme, Rodger, a bad virus. Like the Mad Cow, it harms the brain. Stay away from it.


Next, Rodger does some fuzzy math:

Why does popular faith hold that cutting interest rates stimulates the economy? Because popular faith views only one side of the equation. For each dollar borrowed a dollar is lent. $B = $L. That much is trivial.

Cutting interest rates does cost borrowers less. So, the theory is, a business needing $100 million would be more likely to borrow if interest rates are low than when they are high. Further, consumers are more likely to spend when borrowing is less costly. So making borrowing less costly stimulates business growth and consumer buying. At least, that is the theory.

What seems to be ignored is the lending side of the equation. When interest rates are low, lenders receive less money. And who are the lenders? Businesses and consumers.

You are a lender when you buy a CD or a bond, or put money into your savings account. When interest rates are low, you receive less money, which means you have less money to spend on goods and service — which means less stimulus for the economy.

In short, interest rates flow through the economy, with some people and businesses paying and some receiving. Domestically, it’s a zero-sum game.

Here Rodger expresses one of the things I really don't understand about MMT people. They are often quick to make the distinction between the Federal sector and the rest of us. But they refuse to pry apart the Non-Federal sector and examine the growing imbalances within it.

Changing interest rates, Rodger says, and increases or decreases in borrowing, is all "a zero-sum game". Like MMT, Rodger refuses to look at the effect such changes have on the relative positions of the financial sector and other components of the Non-Federal sector.

Rodger suggests that interest income is just like the rest of income. That is comparable to saying wages are just like profits. I trust you find that notion laughable.

I am the greatest fan of aggregates, by the way. Accumulated totals. I think this is the right way to look at the macro-economy. But the failure to break out subtotals and look at the changing balances between different sectors, is a mistake. It is a mistake that leaves one ignorant of powerful economic trends.

And then what happens is, there is a financial crisis and all you can say is, "I didn't see it coming."


Rodger says:

What seems to be ignored is the lending side of the equation. When interest rates are low, lenders receive less money. And who are the lenders? Businesses and consumers.

As if the borrower and the lender are the same person. The same person on both sides of the transaction. No, I don't see that. I'm not borrowing more or borrowing less from myself, depending on interest rates. That's ridiculous. I'm borrowing from someone who has the money to lend.

But suppose I was borrowing from myself. Suppose we all were. For each of us, our interest cost and our interest income would go up equally. But if we want to save, we are liable to leave a portion of our interest income in savings. This reduces our spendable income, necessitating an increase in borrowing. Thus our interest costs rise, as does our interest income. As does the portion we wish to leave in savings, which again necessitates an increase in borrowing...

Or if another MMT view is true -- "loans create deposits" -- then I'm not borrowing from anyone. The money I borrow is created by the act of borrowing. In that case there is really no lender. So then, business and consumers are not the lenders, despite what Rodger says. But suppose we say the financial sector is the lender. Then the gain from the lending accrues to the financial sector, further skewing imbalances within the Non-Federal sector, the imbalances that Rodger and MMT refuse to examine.

You may wish to point out that employees of the financial sector are members of the non-financial sector. I will grant you that. But I would remind you that the operating expenses of the Federal Reserve amount to only about 5% of its income. And that for lesser banks, expenses are apparently even less. Thus only a tiny fraction of financial-sector income must end up "spent back into circulation" outside the financial sector. Except for the Fed, of course.

I'm not sure I accept the view that loans create deposits. But if Rodger does, then he contradicts himself. For interest is not a zero-sum game. It is an imbalance generator, further skewing imbalances within the Non-Federal sector. And the only way *not* to see it, is to refuse to look.

You are a lender when you buy a CD or a bond, or put money into your savings account. When interest rates are low, you receive less money, which means you have less money to spend on goods and service — which means less stimulus for the economy.

Rodger assumes that all of interest income is withdrawn from savings and spent into circulation. Yet surely, some of the interest income gets rolled right back over into new savings. How much? I don't know. For the sake of argument, say half. So then, only half the money paid in interest circulates back into the economy as money.

The other half circulates back as credit-in-use. That drives up the aggregate annual interest payment required, even if there is no change to interest rates. It also reduces the quantity of money in circulation, interest-free money in circulation. It makes the Debt-per-Dollar ratio higher by increasing the numerator *and* by decreasing the denominator.

I know: Nobody looks at the DPD ratio but me. That doesn't make it irrelevant.


Rodger writes:

A growing economy requires a growing supply of money. Cutting interest rates does not add money to the economy. That is why there is no historical correlation between interest rates and economic growth. During periods of high rates, GDP growth is not inhibited. During periods of low rates, GDP growth is not stimulated.

Has Rodger never heard of the return on investment? If a businessman can earn more by leaving his money in the bank than by sinking it into his business, he is liable to do just that. Cutting interest rates makes a given rate of profit more attractive, and stimulates business activity.

Actually, this is the solution to the problem of excessive reliance on credit. Let the return to the rentier be so low that he prefers productive activity. Today, however, we think of this solution as a "liquidity trap."

Yes, absolutely, a growing economy requires a growing supply of money. And no, cutting interest rates does not directly add money to the economy. It does so indirectly, by inducing an increase of borrowing. At least, before the crisis it did.

And as for Rodger's claim that "there is no historical correlation" between interest rates and growth, well, that is the idea he presents in the title of his post, proposing to show the correlation is a fallacy. In the excerpt, Rodger states his view as fact. But that does not make it a fact. Rodger asserts his hypothesis. Truth by proclamation.

Anyway, I think Sidney Homer would not agree that there is no correlation.


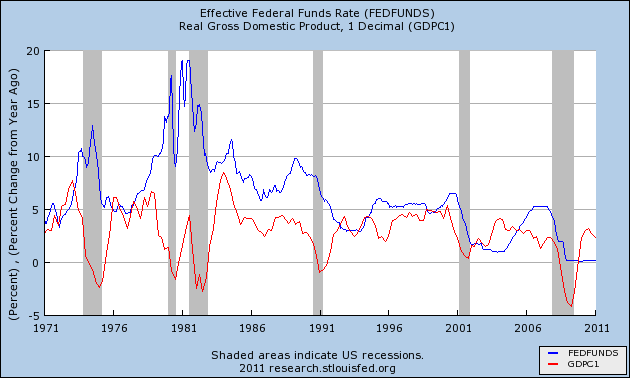
The claim that high interest rates do not inhibit growth, nor low rates encourage it, is an interesting hypothesis. It leads directly to Rodger's graph, which I reproduce here:


You can see from the blue line that rising interest rates did inhibit growth by creating the recessions of 1974 and 1980 and 1982.

Rodger describes the graph:

Blue is interest rates. Red is GDP growth. Not only are low interest rates not associated with high economic growth, but to a slight degree the opposite seems to be true. There seems to be a small correlation between high interest rates and high GDP growth.

I'm not gonna argue the fine points here. Let me point out simply that Rodger's graph begins in 1971, which is just about the end of the good years of the post-WWII period. So, Rodger's graph is a study mostly of the bad years. If you want to make the economy good, it helps to look at the difference between good times and bad. You cannot ignore the good years. Been down so long it looks like up to me is not good economics.

I looked at what FRED has on this. Rodger could have taken the graph back to 1954. I'm thinking, if the good years supported his argument he would have shown them. But he didn't show them.

Oh, and Rodger's graph shows nominal GDP, not real GDP. So it doesn't really even show growth. Really, it shows inflation.That's why Rodger's red GDP line is up over 10% there in the 1970s. We didn't have growth like that. We had inflation like that.

Tuesday, August 2, 2011

I'm not Yellen


A google for macroeconomics blog turns up plenty, with Greg Mankiw for some reason at the top of the list. Second on the list is also Mankiw, with this: "Behavioral Macroeconomics. The Boston Federal Reserve Bank is aiming ..."

First time I heard of "behavioral" economics was when Krugman said he thought it was the future of economics. I'm sensitive to that for obvious reasons (need I say arthurian economics is the future?) so I sort of took an immediate dislike to behavioral.

Anyway, behavioral economics has to be some kind of advanced science like they use in commercials to get you to buy what they want you to buy, and in poll questions to get you to give the answer they want to get.

So, google brings me to Mankiw, who mentions

...behavioral economics (the oddly named subfield that emphasizes the intersection of economics and psychology)...

which is enough to convince me I was right about what behavioral economics is.

Then the boyish Mankiw provides a link to "Janet Yellen's talk at the conference on 'Implications of Behavioral Economics for Monetary Policy'." Now that sounds like it has some meat to it. Meat? I've got teeth. Let me at it!


Yellen writes:

The Federal Reserve is one of a growing number of organizations that have already taken some implications of behavioral research to heart. This year, we began to automatically enroll new employees into our System’s savings plan, defaulting them into an asset allocation fund that includes fixed income, domestic, and international equity investments. Employees who do not want to participate can, of course, easily opt out. But our early experience mirrors well-known research findings: so far, an overwhelming fraction of employees who were defaulted in remain in. Of course, this choice reflects the Federal Reserve System’s appreciation of the striking findings of behavioral economics...

What's that again?

Our early experience mirrors well-known research findings: so far, an overwhelming fraction of employees who were defaulted in remain in.

See? The usefulness of behavioral economics lies in getting people to do what you want them to do.


To the extent that science progresses by disagreement rather than by discovery, behavioral economics *is* the next logical step after "rational expectations":

Some behavioral models assume that people follow simple heuristics or rules of thumb... Indeed, the psychology and economics literature that builds on the work of Kahneman, Tversky, and others generally concludes that people do not make decisions in the fully rational way commonly envisioned in standard macroeconomic models.

See how they stick the word "rational" in there? (It occurs twice in the unexpurgated paragraph.) They're arguing against rational expectations theory. Trying to build a competing theory they can use to vanquish rational-x.

To that extent, Krugman is right: Behavioral is next.

Then Yellen points to further developments that might be called a study of irrational expectations -- or at least of interpersonal neurosis:

Other behavioral models, including those surveyed by Fehr, Goette, and Zehnder (2007) and by Rotemberg (2007) at this conference, go much further, arguing that individual behavior is affected by a reliance on nominal frames of reference and by considerations such as fairness, envy, social status, and social norms.

Finally, in the juicy follow-up, Yellen writes:

Of course a logical question is why such additional complexities are worth incorporating into macro models if the New Keynesian approach, based on costly price adjustment, is empirically satisfactory. The problem is that the New Keynesian Phillips curve is not fully satisfactory. For example, it is not consistent with contractionary disinflations or with the inflation persistence observed in the postwar period.

The New Keynesian Phillips curve is not consistent with contractionary disinflations or with the inflation persistence observed in the postwar period.

In other words, New Keynesian theory -- which Yellen calls "a standard workhorse for policy analysis" -- explains neither the "inflation persistence" since the second World War, nor the "disinflation" associated with economic contraction. Kinda key points to miss, don't you think? I explain both with a single word: debt.

So is the problem debt, as the Arthurian says, or is the problem that raising prices is a costly process, as the New Keynesian says? You decide.


WORD COUNT

Number of times the word "debt" appears in the Yellen post: ZERO.

Monday, August 1, 2011

Why Government Must Grow


The growth of government debt is the only way to offset the growth of private-sector debt. This is why government must grow.

If you don't want such a big government, then you need to support limits on the accumulation of private-sector debt.

It's that simple.