Friday, August 8, 2014
 "We don't have one phone book, Art, that has residential in it...
... We have three phone books and they just have business listings," my wife said.
Supply-side economics, I thought. Another consequence of supply-side economics.
"An All-Time High"
Trading Economics:
Capacity Utilization in the United States decreased to 79.08 percent in June of 2014 from 79.13 percent in May of 2014. Capacity Utilization in the United States averaged 80.63 Percent from 1967 until 2014, reaching an all time high of 89.39 Percent in January of 1967 and a record low of 66.81 Percent in June of 2009. Capacity Utilization in the United States is reported by the Federal Reserve.
An all-time high in 1967. Let's look at the data:
 |
| Graph #1: Capacity Utilization since 1967 (FRED) |
Well... it doesn't reach an all-time high in January of 1967. It starts out at an all-time high in 1967. And it's all downhill from there.
That 1967 start-date bothers me. Yeah, it's a long time back. But not that long. I mean, I graduated high school before then.
If the trend is all downhill since 1967, I'd like to know about the years before 1967. Lots of FRED series go back to 1947. Some go back to 1929. Wouldn't it be interesting to see how Capacity Utilization changed as we entered the Great Depression, and how it changed again as we geared up for World War Two? I'd like to see that.
Well, I can't show you CapUt in the 1930s and '40s. But I can show you the 1950s. I was scrolling through the Economic Report of the President for 1962 the other day (thanks, Marcus!) and I found this graph:
 |
| Graph #2: Capacity Utilization 1953-1961 (ERP 1962) |
This graph shows 1953 to 1961. The FRED picks up in 1967. What's missing? 1962-1966, some pretty good years for the U.S. economy. Maybe I can find a Capacity Utilization graph that includes those years in a later issue of the Economic Report of the President. Wouldn't hurt to look.
I'm thinking I might insert Graph #2 into an AutoCAD drawing, positioned and scaled so the numbers on the "CU" axis match AutoCAD Y-values. Then I can draw a line that follows the tiny dots of the Capacity Utilization line on the chart. Then I can add some yearly verticals and get Capacity Utilization numbers from intersection points in AutoCAD.
Sounds like fun!
Thursday, August 7, 2014
"Gross Output" does not include all transactions
Output is output. Spending is spending.
In a recent post David Beckworth incorrectly identified the data on his graph:
The figure below shows total dollar spending in the United States as measured by nominal gross output (it includes all transactions, not just the final ones used in GDP).
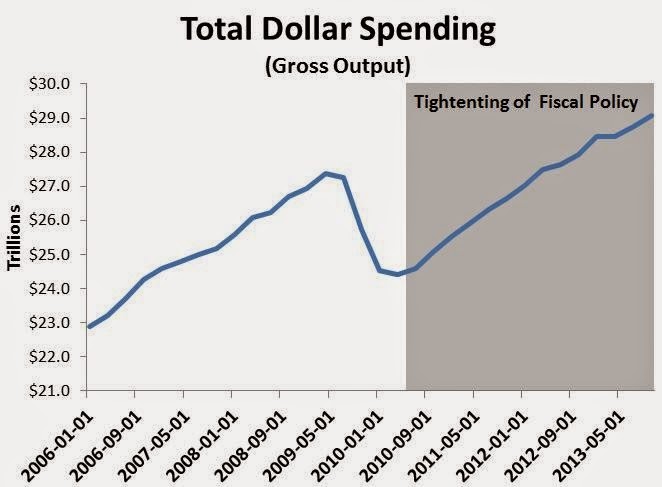
It is important to measure total spending. I absolutely agree with David Beckworth on that. But his graph does not show total spending.
Beckworth is in error when he says gross output "includes all transactions, not just the final ones used in GDP". He would have been correct if he had said "includes all final transactions, not just the final ones used in GDP."
Just one extra word.
You know, I wouldn't be surprised if David Beckworth originally had it right. When he says "... not just the final ones used in GDP" I think he is comparing final transactions in GDP to some other set of final transactions. I think you can see it in what's left of his sentence. Maybe he took out a final to simplify the story. It is a story that demands simplification. I can vouch for that.

So... What is "final" spending?
If you are a business that buys something in order to sell it, your purchase is NOT final spending. If you sell the thing to a customer who plans to sell it to someone else, it is NOT final spending when your customer buys it. If you sell the thing to a customer who plans to eat it or drive it or otherwise use it up -- to consume it, in other words -- your customer's purchase IS final spending.
Two Measures of Final Spending
Suppose in the process of making your product, your fastidious office staff goes through a ton of pencils and paper keeping track of things. That ton of paper and pencils is consumed by your staff. Your guys used it up. It was final spending when you bought that ton of pencils.1There are two measures of final spending: gross, and net. Gross output includes the output your business created and the ton of pencils you bought and used to produce it. Net output doesn't count output that is used up in the production process, like your ton of pencils.
Nomenclature: Gross output is called gross output. Net output, unfortunately, is called Gross Domestic Product.
GDP is net final spending, not total spending.
Gross output is gross final spending. Not total spending.
Suppose we look at the output of just one product. Call it a "thingy". It sells for $5.
Suppose there are five steps in the production process and, at each step, there is $1 of value added. Company 1 sells it for $1 to company 2. Company 2 sells it for $2 to company 3. Company 3 sells it for $3 to company 4. Company 4 sells it for $4 to company 5. And company 5 sells the final product for $5 to a final customer.
There is 1+2+3+4 = $10 of preliminary spending in the first four steps of the production process. And then there is the final purchase, the $5 purchase by a consumer. In our little economy, for each five-dollar thingy we make, there is $10 of preliminary spending and $5 of final spending, and total spending of $15.
Suppose we make 2 thingies in a year. The production process generates $20 of preliminary spending. Final spending adds up to $10. Total spending, final plus non-final, is $30.
If consumers buy both thingies, all $10 of the final spending is counted as Net Final spending, or GDP. If a producer buys one of the thingies and uses it up in the production process, it counts in Gross Final but not Net Final spending, and not GDP.
If a consumer buys one thingy and a producer buys and consumes the other, only $5 of the final spending is counted in GDP. But both count in Gross Output, no matter who buys and consumes the thingies. Gross output is $10, but GDP is only $5.
Total spending is still $30.
Gross Output is a bigger number than GDP. But total spending is bigger yet. Gross Output is not the same as total spending.
/// NOTES
1. I had this wrong in my posts tagged "Gross Domestic Spending". In those posts I assumed that GDP included all of final spending, and that all intermediate spending is non-final. Looking into it more, it seems maybe half of intermediate spending is final and half non-final. We end up with three numbers that are approximately equal: (1) GDP, (2) Other Final Spending, and (3) Non-Final spending.
Wednesday, August 6, 2014
That's how we roll
From The Economic Collapse blog:
The United States Of Debt: Total Debt In America Hits A New Record High Of Nearly 60 Trillion Dollars
By Michael Snyder, on June 15th, 2014What would you say if I told you that Americans are nearly 60 TRILLION dollars in debt? Well, it is true. When you total up all forms of debt including government debt, business debt, mortgage debt and consumer debt, we are 59.4 trillion dollars in debt...
I know, I know. I'm glad to see the right focus for a change.
Michael Snyder's post is pretty good. He reports a lot of numbers, and he's got a lot of links to back them up. Some of Snyder's stats:
- total consumer credit in the U.S. has risen by 22 percent over the past three years alone, and at this point 56 percent of all Americans have a subprime credit rating.
- a newly released survey found that 47 percent of millennials are spending at least half of their paychecks on paying off debt.
- only 36 percent of all Americans under the age of 35 own a home at this point. That is the lowest level that has ever been recorded.
Snyder's links for these numbers include Time and CNN Money.
I'm not offering Snyder's post as recommended reading, but I'm trying to do the next best thing.
Snyder's post combines evidence and evaluation. His evidence fascinated me because a lot of it was new to me. His evaluation, by contrast, seems lacking. That's okay, that's okay. I can go to Snyder for evidence and Snyder can come to me for evaluation. I've been doing this a long time, and I have a unique perspective on debt.
For me, Snyder's evaluation stands out because it differs so much from mine. He writes
... if you were alive when Jesus Christ was born and you had spent 80 million dollars every single day since then, you still would not have spent 59.4 trillion dollars by now. And most of this debt has been accumulated in recent decades. If you go back 40 years ago, total debt in America was sitting at about 2.2 trillion dollars. Somehow over the past four decades we have allowed the total amount of debt in the United States to get approximately 27 times larger. This is utter insanity, and anyone that thinks this is sustainable is completely deluded. We are living in the greatest debt bubble of all time, and there is no way that this is going to end well.
More than 80 million dollars a day for 2000 years? That's effective imagery. 27 times more now than 40 years ago? That's a striking picture. But then, Snyder writes
Somehow over the past four decades we have allowed the total amount of debt in the United States to get approximately 27 times larger.
Somehow? Man, that's disappointing. We have all this debt because policy demands it. And Snyder writes
there is no way that this is going to end well
but that's a prediction. Nobody knows, really. There are ways to fix the problem. But people who are concerned about debt, people like Michael Snyder, have to come to people like me who are focused on debt and on finding that good ending.
Snyder writes
When the last recession hit, total debt in America actually started going down for a short period of time. But then the Federal Reserve and our politicians in Washington worked feverishly to reinflate the bubble and they assured everyone that everything was going to be just fine. So Americans once again resorted to their free spending ways, and now total debt in the United States is rising at almost the same trajectory as before and has hit a new all-time record high.
See the word "So" there? "So Americans once again resorted to their free spending ways...." That's a conclusion. Michael Snyder concludes that we Americans bought our politicians' reassurances "that everything was going to be just fine", and that's why the borrowing resumed. Do you believe that? I don't believe that. Nobody bought our politicians' reassurances that everything was going to be just fine. Nobody.
How then, I ask, did it happen that we once again resorted to our free spending ways? It happened because the economy is structured that way. That's how we roll.

As this graph shows, in 1947 there was about $3.50 of debt for every dollar in somebody's pocket, and $3.50 of debt for every dollar in somebody's checking account. $3.50 of debt for every dollar in all the pockets and all the checking accounts in America. But that was in 1947. By 2007, there was about $35 of debt for every dollar in all the pockets and all the checking accounts in America. Ten times as much.
What does this mean? It means that in 1947, for every new dollar of spending-money that came into the economy, you could expect that $3.50 of new debt would be created. Sixty years later, in 2007, for every new dollar of spending-money, you could expect that $35.00 of new debt would be created.
Why did we once again "resort to our free spending ways"? Because the economy is structured that way. Every policy we have is designed to get the most credit use out of every dollar of money we come upon. That's how we roll.
That's the problem. We didn't "somehow" get all this debt. We got all this debt because policy encouraged and supported it. For example, see what Snyder said:
... the Federal Reserve and our politicians in Washington worked feverishly to reinflate the bubble
Yeah, they did.
And why did they do this? Because they think it's what our economy needs. They think it'll get the economy growing again.
And you know what? In my experience on this blog, too many people seem to agree with them. Nobody wants to be prevented from using credit, in case they need to use credit. (I'm not saying anyone should be prevented from using credit. But people jump to conclusion before I can get to the end of a sentence.)
We have to stop implementing policy that encourages people to be in debt, and start implementing policy that encourages us to pay down debt faster than we otherwise would. Tax breaks for accelerated repayment of debt. Call it the Accelerated Repayment Tax, if you like.
I like.
Tuesday, August 5, 2014
A Great Moderation of Work Stoppages
 |
| Graph #1: The Great Moderation of Work Stoppages Source Data: http://www.bls.gov/news.release/wkstp.t01.htm |
Ms. Yellen ... pointed to tepid wage growth as evidence that it remains easy to find workers.
“The recovery is not yet complete,” she told Congress this month.
Nunes also has Appelbaum quoting Duy on Yellen:
Until you get upward pressure on wages, it is terribly difficult to say that she’s wrong.
It's all very confusing, who said what, says I. But the bits were interesting, and I found myself googling data on wages. I clicked US Department of Labor - Find It By Topic - Statistics - Wages. Then under Subtopics, Wages, Earnings & Benefits. At the bottom of the page I clicked FedStats. And then again, FedStats.
You might want to put FedStats on your list of useful sources.
At FedStats I clicked Topic links - A to Z, then W for WAGES. And then Wages. That got me to a BLS "Subject Areas" page where, under Subject Area Categories I clicked Pay & Benefits. And at the bottom of the Pay & Benefits list, Work Stoppages.
On the Work Stoppages page, under Major Work Stoppages (Annual) I clicked (HTML). Then, under Table of Contents I clicked Table 1. Work stoppages involving 1,000 or more workers, 1947-2013
And, good heavens, that got me the data to make the graph.
Access the Google Drive file.
Monday, August 4, 2014
As I always say...
From yesterday's post:
I don't say "there is too much debt and too little money" except possibly to emphasize that there is too much debt relative to money. Increasing the quantity of money could help reduce the imbalance, if it was done the right way. Beckworth's "program that gives money directly to households" would be one way to do it.
But if there is too much debt, you don't really need to increase the quantity of money. If there is too much debt, what you really need is to reduce debt.
From mine of 13 July 2012:
The basic problem is the imbalance between money and credit-in-use or between money and debt, as you can see on my Debt-per-Dollar graph. The focus on increasing credit-use rather than on expanding the money supply is exactly the wrong focus.
But the focus on expanding the money supply is also flawed. The problem is not that we have too little money. The problem is that we have too little money relative to accumulated debt. And as you already know, this problem is due more to the growth of private debt than to the suppression of money.
The obvious solution -- the correct solution -- is to reduce private debt.
The Debt-per-Dollar graph:
|
| Graph #1: Dollars of Total (Public and Private) Debt, for Each Dollar of Spending Money We Have |
Okay. You know, if the DPD graph really is significant, then the little droopy thing there in the early 1990s must also be significant, don't you think?
I think so. I think you can evaluate the significance of that droop to evaluate the whole concept of debt-per-dollar. Please do.
Sunday, August 3, 2014
The Monument
I admit it: I check my Blogger stats often. Too often. It borders on neurosis.
Sometimes I will look at the list of recently-visited posts, and click one to see what people have been reading. Did that just now. The post was from May, 2011. Fourteen comments, some good ones. The first comment on the post was from Liminal Hack. Liminal asked me:
Going back to basics, if you think there is too much debt and too little money how would you propose to change that? Add more base money? Raise rates? Increase capital requirements?
I've not seen him for a while, but Liminal always struck me as a sharp guy. Me, I don't know anything but my graphs. Liminal Hack knew lots of events and facts and details. He was interesting. So I don't mean to be critical. But I do want to answer his question.
If you think there is too much debt and too little money how would you propose to change that? Add more base money?
Well, first of all, the Fed is already doing that. You could see it in the first two graphs of the May, 2011 post.
Second, I didn't say that in that post. I don't say "there is too much debt and too little money" except possibly to emphasize that there is too much debt relative to money. Increasing the quantity of money could help reduce the imbalance, if it was done the right way. Beckworth's "program that gives money directly to households" would be one way to do it.
But if there is too much debt, you don't really need to increase the quantity of money. If there is too much debt, what you really need is to reduce debt. How Liminal could have missed that, I do not know.
I would reduce private sector debt. There is too much debt relative to the quantity of money because there is too much debt, period. The solution is not to increase the Q of M, but to reduce debt.
Raise rates?
Raising rates is a way to reduce additions to debt, by reducing new uses of credit. That slows the economy. But it does nothing to relieve the existing burden of debt.
The economy growing too fast is not the problem. The existing burden of debt is the problem. So, really, raising interest rates is irrelevant. The interest rate is irrelevant. But the interest rate is one of the main things policy makers and policy critics talk about.
The noise of all that talk clutters the mind and makes people forget obvious things. Obviously, existing debt is not dissipated by an increase in interest rates. So if the problem is "too much debt", why bring up the interest rate at all? Because it's what people talk about?
Stop listening.
Increase capital requirements?
I shouldn't say, because I know nothing of this. Capital requirements may be a good way to limit the growth of debt. That could be useful for the future. But what does it do about the existing burden of debt? I think it skirts the issue.
Knowledgeable as he is, Liminal Hack missed something that's obvious to me: We have many policies in place, designed to increase our use of credit. But we have no policy in place that is designed to accelerate the repayment of debt. Policy is the reason there is "too much debt and too little money". Policy is the reason. I propose to change policy.
The purpose of policy is to change the economy. And I have to say, until the Crisis, policy was most successful. For policy demands of us that we increase our reliance on credit, and that we "manage" rather than pay down debt. The suck-ass economy we have today is a monument to that policy.
Saturday, August 2, 2014
The clock is ticking...
From mine of 6 July 2009:
The question is simply, what is the best way out of this mess?
The quickest way out is just to print money and use it to pay off debt. But it's like touching a snake, isn't it? You can't stand the thought of it.
The quickest way out is just to print money and use it to pay off debt. But it's like touching a snake, isn't it? You can't stand the thought of it.
David Beckworth, 13 June 2013:
... I will endorse ... a helicopter drop, a government program that gives money directly to households.
Mine of 18 June 2009:
Here's the plan: We print money and use it to pay off debt in a big "debt-forgiveness" operation. When money pays off debt, the two cancel each other out. The debt ceases to exist and the newly printed money ceases to exist. It's almost no-strings-attached.
Nick Rowe, 26 July 2014:
... maybe you need to increase the inflation target ...
Mine of 18 April 2009:
Square One: While the economy grows, our reliance on credit increases. When you borrow a dollar and spend it, you take a dollar and put it into circulation. You take money that is not in circulation, and put it into circulation. That credit-money then stays in circulation until you repay what you borrowed. In a very real sense, you have the same power to control the money supply that the Federal Reserve has. Except the Fed can handle bigger quantities of money than you or I can handle.
Once you spend that new dollar of credit, it's gone. It's gone into circulation. No one can any longer see that it is a dollar of credit. It looks like a dollar. And you have increased the quantity of money in circulation.
Now the Federal Reserve monitors the economy. And they notice the quantity of money going up. So they take some of their holdings of Treasury Bills and sell them. The money from this sale is put away somewhere, out of circulation. That's how the Fed fights inflation.
So you and I borrow, and the quantity of money increases. (This is how we make the economy grow.) And then the Fed sells securities and takes money out of circulation. (That is how they fight inflation.) We are left with more debt than before, but no extra money in circulation. The extra money we created, that we might have used to pay off debt, is gone. Do you see how out-of-balance this process is?
After the process is repeated over and over for most of a century, by more and more people, for an increasing variety of purchases, we end up with a lot of debt in the economy, and not a lot of money we can use to pay off that debt. This is the underlying process that eventually creates a credit crisis.
There is a better way. Suppose I borrow some money and spend it, which increases the quantity of money in circulation. But say the Fed doesn't take that money out of circulation. Instead, I pay back the money I borrowed. That's it: That's the plan. I pay back the money I borrowed, which takes dollars out of circulation. The extra money comes out of circulation, and my debt is reduced at the same time. Do you see how beautifully balanced this process is?
But what makes me pay off my debt? Well, I'd pay it off anyway, sooner or later. And the Federal Reserve doesn't take the money away, so funds are more readily available. But the key concept is that new tax incentives are set up, incentives that encourage us to accelerate repayment of our debt. Tax credits that give you a break on your taxes when you make extra payments on your existing debts, or a tax rate that varies up and down somehow with your particular level of indebtedness.
Tick, tock.
Friday, August 1, 2014
Bad timing
I don't mean to use this as a follow-up to my last three posts. I think Steve Roth is right: something interesting is going on with Market Monetarists lately.
Just think of this post as a reminder of how empty economics can be.
Jazzbumpa writes:
Market monetarists like Beckworth and Sumner are smart guys, but their reasoning is flawed. They define monetary policy not in terms of either money or policy, but as GDP growth, which is a resultant. This is either circular reasoning or assuming the conclusion.
That reminded me of something Daniel Kuehn said:
...for market monetarists like Scott Sumner, who seem interested in going beyond decision rules and actually offering an analytic claim, there seems to be no way to logically make the statement "we have done the market monetarist policy rule and the goal was not achieved". Why? Because if NGDP level targets have not been reached then by definition you haven't been doing market monetarist policy.
Fair criticism, I think.
Subscribe to:
Posts (Atom)
