Friday, December 5, 2014

Day 17, Page 12


Clopper says the NIPA series Net interest and miscellaneous payments on assets is a measure of all interest that is in GDP. That's a pretty useful piece of information.

I took the two "Net interest and miscellaneous payments on assets" series that we looked at yesterday and put 'em on a graph with FRED's "Monetary interest paid", the green one on Graph #1 here. The two "Net interest" series are dwarfed by it:

Graph #1: Net interest, quarterly (red) and annual (blue); and Monetary Interest Paid (green)

Obviously, then, I had to see the "as a percent" version:

Graph #2: All the Interest in GDP as a percent of Interest Paid

"Monetary Interest Paid" only goes back to 1960, so we lose the picture before that date. And because the series is annual, FRED converted the quarterly "Net interest" series to annual. That made the red and blue lines the same -- both annual, I mean -- and now the blue line is completely hidden by the red.

So, what do we see?

The interest in GDP rose to around 30% of interest paid in the mid-1970s, then trended down to half that number in time for the crisis. Up and down, part of the cyclical thing.

Now I'm thinking about all the interest that is in GDP, subtracted from GDP. I'm thinking about looking at GDP with and without the interest. I'm thinking about adding in all the interest that's not counted in GDP, and comparing that as well. The interest that's not counted is still a cost. We still have to pay it. It still affects demand.

Thursday, December 4, 2014

Day 16, Page 12


I've been trying to stick to the topic, Clopper Almon's The Craft of Economic Modeling. Pretty good success, but I've had to skip a few days' posting. Perhaps you noticed.

The first of these "modeling" posts is dated 18 November. As of today, that's 16 days and counting. Now I'm going to present a short excerpt from page 12 of the book. And then I'm going to drift a little from topic.

In Table 1.2 Professor Almon presents a list of NIPA categories "as a sequence of equations". And then he makes sense of it. He takes GDP and, by gradually adding or subtracting NIPA categories, clarifies how it differs from Personal Income. Along the way, Almon tells me things I need to know, For example:
Finally comes the puzzling pair

   -      netintm      Net interest and miscellaneous payments on assets
   +      piint      Personal interest income.

Net interest is all interest paid by business less interest received by business. It is also all the interest that is included in GDP. Interest paid by consumers on credit cards, automobile loans, or installment credit is not counted as part of Personal consumption expenditure and therefore is not part of GDP... Similarly, interest on the national debt is not part of Government purchases of goods and services... Interest paid by business -- and thus included in the price of goods -- is, however, included in GDP. In particular, interest on home mortgages is included because home owners have been converted into a fictional business in the NIPA; they rent their homes to themselves and the imputed space rental value of these homes, including the interest costs, is part of Personal consumption expenditure. This pair of lines, therefore, removes all interest that is in GDP and adds back all the interest received by persons. The net effect is positive because of the large interest payments of the government to persons.

Now don't you feel as if you know more than you did two minutes ago? I do. Every time I read that paragraph.


You know my fascination with finance, and with the cost of interest. So eventually -- one doesn't spend 16 days on 12 pages without reading at least some of it more than once -- eventually I found myself at FRED, in the search box with net interest.

Eleven pages of results. Halfway down the first page or so I saw Net interest and miscellaneous payments on assets. Whoa! What's that? Net interest and miscellaneous payments on assets.

And what does Professor Almon discuss? Net interest and miscellaneous payments on assets. It's a match.

Oh wow. Okay. That can't be coincidence. So I looked at that item in the search results. There are two entries:

     1. Annual data going back to 1929.
     2. Quarterly data going back to 1947.

I graphed the two of them together:

Graph #1: Net Interest and Miscellaneous Payments on Assets

Yeah, okay. How about on a log scale?

Graph #2: Same as Graph #1, but on a Log Scale
Oh my.

Okay. Now not log, but relative to GDP:

Graph #3: Same as Graph #1, but as a Percent of GDP

There it is -- cyclical behavior. Now I'm in my element.

Note that the decline-from-peak since 1980 has lasted twice as long as from the 1932 peak, so far. And the low we've reached so far is still three times as high as the low we reached in 1946.

Sunday, November 30, 2014

G7: Trying to get the damn door open


Soon as we got past that first model I hit a brick wall. There are five models to consider in Part 2 of Chapter 1 of Part 1 of The Craft of Economic Modeling. But it's like they left something out.

The first model we did, that one's not even numbered I guess. In Part 2 of the chapter they talk about five models, starting with number one:

Model 1 just sets out the variables and identities that are central to the system of national accounts used in the United States. We may call it a pure-accounting model because it makes connections among variables based only on accounting definitions, not on economic behavior.

Okay.

On page 9 he gets into Model 1. There is a pretty interesting review of how the NIPA categories break down. Clopper Almon explains it well. For example:

Business current transfer payments (net) include legal settlements and theft losses. We first subtract the entire amount and then add back in the portion which went to persons. The stolen case of Bourbon is counted as income to the thief and, by the way, appears in Personal consumption expenditure and thus in GDP.

And I really like how he every once in a while tells you what he thinks:

If we may, for the moment, skip the Statistical discrepancy, which should be zero conceptually, we have reached Personal income before government action. This item is not in the official accounts, but I find it a convenient point of reference.

But things are missing. He writes
We can now summarize this first model in the following master file which shows the actual commands to the software we use to compute this model.

And he provides the text for that "master" file. But... is "master" the name of the file or just a generic term? And if it is the name, then what is the file extension?

I think maybe the file is called master.add and I'm going with that for now. But I'm not sure. And where is the data? He did say in passing that

The variable names shown in the code column are the ones used in the Quarterly Income and Product (Quip) data bank...

But I had to dig to find that quote, and now I have to dig to find a "Quip" file, and then I have to hope I've been making good guesses.

Things are missing. Yeah, yeah, I remember: In the intro Almon wrote, "Of course, as in any craft, a book can only help, not replace, a living teacher."

Yeah, yeah.

// UPDATE 4:45 pm

The Master file doesn't have an extension. And the first QUIP.ZIP file I found was an old one, from 2002, from the Inforum EconData Archives. You don't want to use that one. Too many variable names have changed. I started fixing errors, with some success, but it just got to be too much.

I found a better QUIP file. I hope, better. I didn't even test it out yet. Between fixing errors in the first QUIP and looking for a newer one, I didn't have any energy left to look at it once I found it.

Actually, what did I find? It was the AMI file, the "Accelerator-Multiplier Interaction" model, a ZIP file with a few versions of the MASTER file (no extension) and a G.CFG and the QUIP bank files and some other stuff.

This is starting to come together. A lot of work, but I'm making progress. Pretty soon I'll be able to get thru that first chapter. I'm itching to do more.

Saturday, November 29, 2014

Some little things I've learned about G7


When I first double-clicked the icon on my desktop to start G7, it opened a configuration utility that said my "Present Working Directory" was C:\G7\Demo\Basic_G.

(Actually, at the time it said C:\PDG\Demo\Basic_G but I have since changed the name of the installation folder to G7 because "PDG" doesn't mean anything to me. I will just refer to it as the G7 folder, and pretend it was always thus.)

The configuration utility identified my Present Working Directory, my Workspace Bank (ws.bnk) and my Default Bank (mrts.bnk).

When I clicked OK, the Configuration Utility closed and two other windows opened -- the G7 program, and an editor containing the basicg.add script.

When I closed the program and came back to it later, it identified the same working directory and the same banks. And it opened showing the same text it showed the first time.

I went around that circle a few times. But then I renamed my G7 installation folder from C:\PDG to C:\G7. And after that, the original demo wouldn't work. I finally solved that problem by using the BROWSE button in the Configuration Utility. The button opens a regular, Windows-looking FILE OPEN window and lets you change the working directory and select a configuration file.

In the Demo folder, for example, is a Graph folder and in the Graph folder is a G.CFG file. When I opened that config file the Present Working Directory and the Default Bank changed in the Configuration Utility. When I clicked OK to close the utility, G7 opened in the Graph folder, with a graph.add file open in the editor.

If I then close G7 and open it up again, it comes back with the Graph folder as the working directory and graph.add in the editor, just as it was when I closed G7.

So this tells me how to get the original demo back: Start the Configuration Utility, click BROWSE, move from the Demo\Graph folder, to the Demo folder, to the Demo\Basic_G folder, and open the G.CFG file I find there.

Click OK to close the Configuration Utility, and you are back to the original demo that came up the first time you started G7. Almost. The text field at the right end of the G7 toolbar says the graph.add file is still loaded and ready to run -- even though you can see the basicg.add file in the editor, plain as day.

So I clicked the LOAD button on the G7 toolbar, and double-clicked the basicg.add file to make it replace the graph.add file. After that, the original demo worked just like it did at the start.

So what did I learn?
  •   G7 wants to start up where it left off.
  •   That makes the BROWSE button a very useful tool, and
  •   it makes the LOAD button a very useful tool.

It seems a little odd maybe that one script file is loaded in the editor, and a different script file is loaded in G7. But I've seen that before, with Lisp files and AutoCAD. You have the Lisp file open in the editor, and you add some code to it, and you run the thing and it doesn't work. No, because the changes you made are only in the file you are editing, not in the file that is loaded into AutoCAD.

The Lisp editor solves the problem by giving you a way to "load" the file into AutoCAD. They don't say that you're loading it into AutoCAD. They just say that you're loading it. But after you do it, AutoCAD knows about the changes you made. And now you can test them out.

With G7, after you use the BROWSE button and change things in the Configuration Utility, when you get to G7 you have to click the LOAD button to load the script into G7, even though it is already loaded into the editor.

It's strange how similar this is, what happens in AutoCAD and what happens in G7.

Thursday, November 27, 2014

Thankful for "G7"

This series of posts began on 18 November

Happy Thanksgiving.

First chance I've had to take a look at G7 since installing it.

When you first run G7 a configuration window opens. I don't understand the settings, so I just click OK. The configuration window closes and two new windows open. The bigger window is the G7 program. The smaller one is a demo file. There is no activity.

The G7 window tells my "present working directory" and provides the title of the data that's been loaded in. Looks like a setting in the configuration window determines which data gets loaded in.

The smaller window is more interesting. You can read it:

# This demo script provides the user with a solid foundation...

Several lines of text there, with a crosshatch before each line. I guess we should call it a "hash symbol" now. Several lines a "hash" prefix. Then

cls
addp n

CLS means CLear the Screen. I know that one. That's from BASIC. GW-BASIC had the CLS command, back in the days of DOS.

I don't know what the ADDP N is. Next there are several more lines of text

ic If you have any trouble with this demo script...

but this time the lines all start with the letters IC instead of a hash symbol. That tells me these lines are for a different purpose than those other lines of text. (When you run the script, the lines with the IC prefix are displayed as text. The lines with the hash symbol prefix are not displayed. I conclude that the hash symbol means the line is a comment, in the G7 language.)

Then there is the line

pause "When you are done reading, click OK."

followed by another CLS command.


Back in the bigger window, G7, I can type and see what I'm typing, but nothing happens when I press ENTER. I played with this a bit and had a thought. The smaller window is an editor... The smaller window is for user input. The bigger window is for G7's output. So then, if ENTER doesn't work in the big window it's not a problem. That window isn't for my input.

In G7 (the bigger window) across the top there is a toolbar with a few buttons: "G Editor", "Change Directory", "Change Font" ... I clicked on "G Reference". A Windows window popped up instead of the G Reference. The window said Windows Vista can't read older-style Windows Help files. There was a link to a download, an enhancement to Vista that lets me read the older Help files. It was easy to resolve this problem. But file it under Stupid Problems.

Windows can't read Windows Help files????? Give me a break!

So now the "G Reference" button opens the G Reference, and that'll be a handy thing. I went there, and went to "The Basic 11 G7 Commands" first, as they suggest.

This is amazing. Look what they have for the f command:

f <variable> = <expression>
f <variable>{<date1> [- <date2>]} = <expression>
    Defines variable on left in terms of variables in expression on right.

f x = gnp/(1. + unemp[1]*@exp(.25*time))
f index = x/x{85.1}

Note:  []  denotes lags  (t-1) is denoted [1]
        @  introduces a function (see list of functions)
        {date} on the right-hand side denotes a specific observation. 
        {date} on the left-hand side assigns values over the given range of periods.


First impression: Wow!

They give two forms for the "f" command (shown in green). The first one looks like a pretty simple assignment of value:

<variable> = <expression>

Create a variable and assign a value to it. Simple, everyday stuff you could find in any computer language, right? Yeah but hold on a minute. I read about the "f" command in the demo. Here's the relevant part of the demo script file:

ic =====================
ic HOW TO FORM VARIABLES
ic =====================
ic
ic f <variable> = <expression>
ic
ic A variable on the left-hand side is defined [as] the expression on right-hand
ic side. The new variable is stored in the workspace bank and can have
ic any name. For example, if you wanted to create an index of rtlsales44111
ic using June of 2000 as its base, type
ic "f index44111 = a.rtlsales44111/a.rtlsales{2000.006}" into the
ic command line. This new variable can be printed or graphed.

addp y
#
f index44111 = a.rtlsales44111/a.rtlsales44111{2000.006}
ty index44111
gr index44111
#
addp n

pause "When you are done reading, click OK."
cls


The number 44111 identifies some particular data series (sort of like TCMDO identifies a particular data series at FRED). You can make a variable that is an "index" of that series. The line

f index44111 = a.rtlsales44111/a.rtlsales44111{2000.006}

divides each value of the source data series by the June 2000 -- 2000.006 means the sixth month of year 2000 -- divides each value by the June 2000 value of that series. This creates a whole new data series that looks like the source series, but with the June 2000 value shrunk down to 1.0 and all the other values shrunk down in proportion. So the "variable" we create can be a whole new data series.

This is a big deal.

You'll often see me talk in those terms. I might show you a graph of TCMDO divided by GDP that displays 50 years of quarterly data. Four values for each year, so 200 values were used to make the graph. But when I talk about how these values change over the years, I say "the number changed" over the years, as if it was just one number rather than 200 separate numbers. Just one number (for a period of time).

Just one variable in G7, but the variable holds a whole data series. This is good stuff.

Tuesday, November 25, 2014

Installation: "I should have left the default"

This series of posts began on 18 November

EDIT, 3 DECEMBER 2014

Normally, I don't change my posts. This one has been undergoing major revision, because I don't want to steer anyone wrong who might use it as an instllation guide. So, this isn't the same post it was at the start.

IF YOU DON'T INSTALL G7 CORRECTLY, IT WILL GIVE YOU PROBLEMS. I HAVE TO KEEP EDITING THIS POST UNTIL I GET THE INSTALLATION RIGHT. I THINK WE'RE THERE NOW.

BUT, YEAH, I DID THINK WE WERE THERE BEFORE, TOO.

Inforum's The G7 Regression Program page is pretty friendly. And you can download the G7 from there.

So that's where I went, and clicked the shiny button to "Get G7 Here"
That took me to the Software Downloads page
Then I clicked the blue PDG link for the "Stable" version

PDG.exe, 26.3 meg
It's taking a few minutes...

The Software Downloads page says you have to "unblock" the file after the download. While waiting, I looked that up.

Delay's Blog says "ZIP files should be "unblocked" before their contents are extracted."
http://blogs.msdn.com/b/delay/p/unblockingdownloadedfile.aspx

TechNet says "By default, these files are blocked to protect the computer from untrusted files" and wants you to "review the file and its source and verify that it is safe to open."
(I forgot to grab the TechNet link.)

Nobody says how you're supposed to know if something is "safe".

The download took five minutes. I moved the file to a "temp" folder, unblocked it, and ran it.

WHEREVER YOU RUN THE DOWNLOAD FILE, IT CREATES A PDG FOLDER AND PUTS ITS FILES IN THAT FOLDER. SO MY CONCERN ABOUT LITTERING C:\ WITH FILES WAS UNFOUNDED. IT'S A SMART CONCERN, BUT IT WAS UNFOUNDED.

WHEN YOU RUN THE PDG.EXE DOWNLOAD FILE YOU GET SETUP.EXE AND A HANDFUL OF RELATED FILES. (I SHOW A SCREEN SNIP BELOW.)

I'm using Windows Vista, by the way, and hoping to upgrade at Christmas...

I didn't know what to do next. But the Software Downloads page starts by saying: "To install G7 on a machine for the first time, please follow the instructions on the G7 page." So I clicked that, and ended up back at the friendly page. It says:
PDG - This is a self-extracting ZIP file of the G7 program and other Inforum software. After downloading this file, run it by double-clicking on it, or by typing its name at a DOS prompt. Do this in a temporary directory. One of the files that will be extracted is SETUP.EXE. Next, run this setup program, and the InstallShield session will begin. This will load the software into the default location of C:\PDG. See the Readme files that are included in the installation for further instructions.

So far so good. Next, run setup.exe, the InstallShield Wizard.

A pretty picture of a house (or maybe, the building that houses Inforum) comes up in the InstallShield Wizard. After clicking "next" a couple times, a readme file comes up. This is not like something that I might throw together myself. It is all very professional. Trustworthy.

"307 file(s) unzipped successfully."

WHEN YOU RUN SETUP.EXE YOU GET THOSE 307 FILES.

OKAY.
FIRST YOU DOWNLOAD A FILE NAMED PDG.EXE AND UNBLOCK IT. THEN YOU RUN IT, AND WHEREVER YOU RUN IT, BY DEFAULT IT CREATES A FOLDER NAMED PDG AND IT PUTS A HANDFUL OF FILES IN THERE... INCLUDING SETUP.EXE.


It wanted to extract to c-root, C:\ and this time I let it. Here is the result:


A handful of files, including SETUP.EXE, in a PDG folder. Then I ran the SETUP.EXE:

THEN YOU RUN SETUP.EXE, AND BY DEFAULT IT CREATES A PDG FOLDER IN THE ROOT, AND PUTS 307 FILES THERE... INCLUDING G7.EXE, THE FILE YOU WANT.


I let it install in C:\ and here is the result of that:


The installed files are in a PDG folder which is in C:\. It works, if you let it.

Oh good, Windows Vista is given as an example of the environment you might be using for G7. The first stuff I read on this a few days back said Windows XP or 7 or 8 but didn't mention Vista. So far so good, then.

The readme says you have to add C:\PDG (the path to where G7 will be installed) to the Windows PATH variable. I did that right away because I wouldn't remember to do it after the installation is complete. The instructions are right there in the readme, and they are excellent. I didn't have any question in any step of the process. When they tell you to click OK, they also tell you which window you should be in at the moment, and I was in that window every time. I think that's the best computer instructions I ever saw.

THE INSTRUCTIONS ARE VERY GOOD. MY PROBLEMS AROSE BECAUSE I DIDN'T TRUST THEM, AND I TRIED TO DO THINGS TO PREVENT PROBLEMS. MY PROBLEMS AROSE FROM MY EFFORT TO PREVENT PROBLEMS. SAD BUT TRUE.

Oh, I'm gonna quote this bit for later:
To employ some of the newest features in G7, your system must have an installation of the Microsoft VC++ 2005 Redistributable package. You can find a copy of the VC++ installer under C:\PDG\VC++Installer. Run the installer before attempting to run G7.

Run the installer before attempting to run G7... but after I install G7. Which I didn't get to yet. I'm still reading the readme.


Okay, I'm done with the readme.

There are some questions related to installation. I just accept the defaults, unless I see something odd.

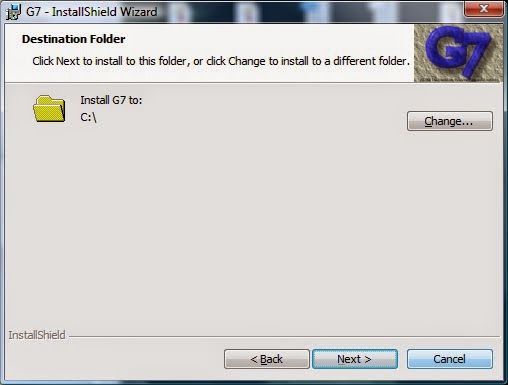
I see something odd. The InstallShield Wizard's Destination Folder window by default will install G7 to the root directory C:\ YEAH AND THAT IS OKAY!!! INSTALLSHIELD WILL CREATE THE PDG FOLDER IN THE ROOT DIRECTORY (AND THAT IS WHAT I WANT!) AND WILL PUT ALL THE INSTALLED FILES INTO THE NEW PDG FOLDER. IT WILL WORK FINE, IT YOU LET IT.

LEAVE INSTALLSHIELD THE DEFAULT PATH C:\ AND YOU'RE GOOD. I clicked next.

The "Typical" setup type installs everything. That's the default and that's what I want.

Now, click Install...
Start 5:12 AM...
After a moment the activity begins...
Oh, done! at 5:14.
Readme? Yes...
Yeah, this is the same readme file that I read before. I had to do something... Run the installer for VC++

Okay, now I can close the Temp folder and the Temp\PDG folder, and open C:\PDG.

VC++ Installer is there. It installs quickly but then there is a long delay while it says "time remaining 0 seconds"... but the window closed while I was typing this. Okay.

Close the VC++ Installer folder...
Close the Readme window...
Close the Control Panel window where I add PDG to the path...

Now I don't know what to do. Run the thing, I guess.

In the GDP folder I double clicked on G7.EXE and two windows opened. It's a demo. The one window is the demo and the other is the script for the demo, it looks like. But nothing is happening. In the script I see things like "When you are done reading, Click OK" but they don't show up in the demo.

Maybe I have to *run* it?

I click the triangle symbol in the demo window menu, the right-pointing triangle. The thing runs, I get a paragraph of text, and a "When you are done reading, Click OK" message.

Okay.

Monday, November 24, 2014

"The first section of chapter 1 does not require the use of computers"


Today's title is a quote from The Craft of Economic Modeling, Part 1 (PDF), by Clopper Almon. I take the quote to mean that I don't have to begin by getting into the modeling software they call G7. I take it to mean I can start with a spreadsheet. Not pencil and paper and slide rule.

Page six of The Craft presents Table 1.1, a table of data to use for the first simulation. For the first model, I mean. Ten columns of numbers. Most of them are incomplete. The first column (which is complete) contains the numbers 1 thru 24, in order. It is labeled "Line" (meaning 'row number') but I take it to represent years 1 thru 24 of the simulation I'm going to create.

Three other columns are also complete, each with 24 values. Here we have numbers that are predetermined and invariant, regardless of how the simulation works out. These complete columns hold "exogenous" values. Those values don't depend on the outcome of the simulation.

In each of the six remaining columns, only the first few numbers are filled in. These are starter values. A lot of them are used by the calculations of the model -- used by calculations to fill in the blanks where numbers are not given.

The calculations produce "endogenous" values. If things go a little differently in the simulation -- if you change an exogenous value or if you change a calculation, say -- the endogenous numbers will probably all change.

When I put the numbers into a spreadsheet, I switched over to calculations as soon as I could. That way I could compare my calculations to some of the givens, and check my work. In the Zoho spreadsheet, I show the numbers in blue if I used given values, and black if I used calculations. The table of numbers starts just below this graph:


Check my work. I was expecting my graph to come out like the one on page 5 --


But I only got two growth spurts. They got five. I checked my work and didn't see any mistakes. (Oh, there were mistakes. But you look at the graph and see the date when it seems to go crazy, and then you check your calculations on the rows around that date. And you fix 'em before you put it on your blog.) I think I got all the mistakes, but if you find anything fishy, let me know.

I'm assuming the page 5 graph was generated from different data, and that's why the graphs don't match.

If you create the model yourself, do let me know how it comes out.

Note: When you enter the equations it's easy to use the wrong column. It's easy to confuse spreadsheet columns with economic data category columns. For example, the last spreadsheet column used here is column J, which contains economic data column Y, Disposable Income. It's a little messy, keeping it straight. But if you don't do it right you'll know, because your graph won't look right.

// This series of posts began on 18 November 2014.

Sunday, November 23, 2014

Why


To speak of cause and effect in economics, one must have in mind some kind of model.  It may be an entirely subconscious model, or a model spelled out in theory but never quantified or tested, or an explicit, quantified model that has been subjected to careful testing and scrutiny. I need hardly add in which sort I have the greater confidence.

Friday, November 21, 2014

Columns in a spreadsheet go up-and-down, like columns in a building. Rows go across.


Following up on the post of 18 November...

When I picture an economic model, I picture doing it in a spreadsheet. I need a column for "Year", one for "GDP", one for "Debt", one for "Addition to Debt", and stuff like that -- whatever it turns out that the calculation seems to need. And then, make a row for each year of the model's life. I plug in a few numbers on the top row, then fill the rest of the first couple rows with calculations. And that's it.

I copy my last completed row down to the rows below, for each year of the model's life, 50 years maybe.

The trick is to plug in the right calculations. Those calcs want to mimic the actual relations between GDP and Debt and Additions to Debt and stuff, or what I imagine those relations to be. You know: If we spend a little less, we save a little more this year, but our reduced spending could affect GDP next year. Those kinds of relations.

When the bug bites I'll set up a spreadsheet like that and mess with it for a while, changing calculations, adding columns for new quantities, and looking at graphs of the resulting data.

I never manage to get graphs that mimic graphs of economic data. So I play with it for a while, then set it aside.


After I wrote the notes above, I went and read the first few pages of Clopper Almon's The Craft of Economic Modeling. Actually, Clopper says "The first section of chapter 1 does not require the use of computers." I printed out those six pages, so I could hold them in my hand.

Looking at the equations like

C = .6*Y[1] + .35*Y[2]

and

Q = C + I + G + X - M

where C is Consumption and Q is output, it occurred to me that each of the equations in the model could fit to a column of my spreadsheet. You copy the equation down the cells of the column to get each year's number. Oh -- you leave out the Q to the left of the equal sign, and you put the equation in the column that you have labeled Q!

Do you know how long it took me to figure that out???

So each of the equations in a model can be a column in a spreadsheet. Understanding this helps me understand economic models. What I've been doing for all these years is making a column for each variable I want to calculate, and then fudging the equations without ever really getting to look at the equations. I would start out with something that made sense to me, and keep filling in blanks until I had two or three rows worked out, then copy the last row down to represent 50 years or so, and then graph it.

Then I'd look at the graph, decide it didn't look right, and start tweaking my equations. First it would be adding columns to get more variables, and then working those variables into calculations and copying them to the rows below. Then it was things that made less sense, but might have some bearing. After a while it would be acts of desperation, just trying to come up with numbers that would produce a graph I could live with. And then I'd put the thing aside for a while.

I think it's probably better to pull out the equations so you can look at them like Clopper does, like I always see when somebody is describing a model.

But at least now I know: If there's two equations I need two columns in a spreadsheet for variables; if there's six, I need six.

No, no -- I'm not going to work only in spreadsheets. I want to download the free G7 software and learn how to use it. But I have to get there at my own pace. And I have to start with what I know.

Spreadsheets it is, then.