Sunday, June 11, 2017

The cost of debt and the cost of credit are two different things


The title grabbed me immediately: Capital Controls and the Cost of Debt.

Not capital controls. It's the cost of debt that caught my eye. I still don't know what "capital controls" are. I still don't even know what "capital" is. But the cost of debt, yeah, that one I know. So I clicked the link (it's the loader page for a PDF) and read the first sentence of the abstract:

Using a panel data set for international corporate bonds and capital account restrictions in advanced and emerging economies, we show that restrictions on capital inflows produce a substantial and economically meaningful increase in corporate bond spreads.

I see now how difficult that sentence is to read. Too long. On the first read, the last three words stuck in my head: "corporate bond spreads."

Interest rates. Spreads are interest rates, differences in interest rates. That's not the cost of debt.

Interest rates are the cost of credit, the cost of borrowing. The cost of debt is something entirely different. The cost of debt is the cost of the whole accumulation of borrowings. And the size of that cost depends primarily on the size of the accumulation. Not on interest rates.

Interest rates affect the cost of the next dollar borrowed. That's entirely different.

For example:


These days, the cost of debt is high and the cost of credit is low. That much, I know.

Thursday, June 8, 2017

I can do simplistic, too


At the New York Times N.Gregory Mankiw offers A Tax Cut Might Be Nice. But Remember the Deficit.

Anyone who reduces the problem to taxes and deficits is a complete ass. Yeah, that means most everybody. But maybe it's not Mankiw; maybe it's his editor. Can't say. So I started reading the article to see what I can say.

Mankiw's first sentence includes this question: "Should we have a tax cut that increases the budget deficit?" And his last sentence is "In this era of alternative facts, it would be far too easy to pass irresponsible tax cuts and hand the bill to future generations." So yes, Mankiw reduces the problem to taxes and deficits. Therefore, Mankiw is an ass.

Wednesday, May 31, 2017

Remembering


Two posts back I said Marcus Nunes was concerned that people would accept the new, lower trend of economic growth and forget the higher trend of the eighties and nineties and naughts. "Forget" was my word. Maybe it wasn't quite right.

But Marcus does say "there´s a wide acceptance of the new trend." People are giving up on trying to get back to that old, high trend. Maybe the word "forget" is not so far off, after all.


In that post I used Marcus's graph, which goes back to the late 1980s and shows the high trend and the low trend, both. My post also quoted Menzie Chinn talking about a trend based on the 1984-2007 period and saying this trend now seems implausibly high. Chinn wants us to forget about the high trend.


I find it interesting that Marcus and Menzie both show the old trend existing since the 1980s. Interesting, because for a long time it was widely recognized that there was an economic slowdown in the mid-1970s, from which we never fully recovered. The older trend, from before the mid-1970s, was even higher than the old trend that Marcus and Menzie show.

Evidently, the older trend is even more completely forgotten. "Abandoned" might be the better word. Let's have a look.


FRED provides the Real GDP data series GDPC1. Menzie Chinn provides the range of dates used to establish the trend. Excel provides an exponential trend line and the trendline equation:

Graph #1: Real GDP (blue) and the Exponential Trend (red) for 1984 to 2007
Showing an exponent of approximately 0.0313, the equation indicates average annual growth of about 3.13% for the 1984-2007 period.

I used the trendline equation to calculate values for the 1984-2007 trend, to extend the trend from 1947 to 2016. Then I showed those values as a red line on a new graph, along with Real GDP. By this method we can see how well the 1984-2007 trend fits the RGDP data for the full 1947-2016 period:

Graph #2: Real GDP (blue) and the 1984-2007 Trend (red) in the 1947-2016 Period
It appears to be a good fit, right up to the problems of 2008. Then Real GDP falls away from the trend and establishes the new, lower trend, as discussed by Marcus Nunes, Menzie Chinn, and others. Even before the 1980s the fit looks good, in the 1970s, and in the late 1960s.

Before about 1965, Real GDP (blue) does run persistently below the 1984-2007 trend (red). It doesn't appear to be off by much. One good way to tell how much it is off is to show a trend line based on those early years on the graph.

According to what Scott Sumner said ("growth in US living standards slowed after 1973"), Ross Perot's graph in yesterday's post, and the observations of others, 1973 seemed to be a good end-date for the early years' trend.

Then, for the start-date, I remembered Marcus telling me he likes to omit the years before 1952 "to avoid the post war adjustment which distorts the data." I like to imitate what I see economists doing, so I went with the 1952 start-date.

This next graph shows the same Real GDP (blue) and the same trend line based on the years 1984-2007 (red) as the graph above. But to gauge the difference visible in the years before 1965, this graph adds an exponential trend line (black) based on the years 1952 to 1973:

Graph #3: RGDP (blue), the 1984-2007 Trend (red), and the 1952-1973 Trend (black)
In the early years, there is not much difference between the trends. But there is a huge difference by the end. Menzie Chinn's 1984-2007 trend brings Real GDP to 20 trillion dollars by 2016. The 1952-1973 trend brings Real GDP to 30 trillion. And Menzie thought the lower of those numbers was an "implausible" outcome!

But what if these are not implausible outcomes?

// The Excel file

Tuesday, May 30, 2017

The previous slowdown in economic growth


Arguing with Paul Krugman, Scott Summner wrote: "I am not denying that growth in US living standards slowed after 1973, rather I am arguing that it would have slowed more had we not reformed our economy."

Sumner accepts the view that the growth in US living standards slowed after 1973.

The classic graph that shows that slowdown is this one from Ross Perot:

Graph #1 Source: Ross Perot, United We Stand
(from when Perot was running for President in 1992)
Before 1973, living standards would double in less than two generations. After 1973 it would take 12 generations for living standards to double.

If a generation is 25 years: Before 1973 it took less than 50 years for living standards to double. After 1973, according to the graph, 300 years.

Scott Sumner says things would have been even worse if not for the Reagan-era reforms.

Perot lost the 1992 election to Bill Clinton, and during the Clinton years the economy improved. (I'm talking chronology here, not causality.)  The "generations required" number came back down, but only for about ten years. Then it went up again. And after that we had the financial crisis and recession, and the "generations required" went up even more.

Sunday, May 28, 2017

Skipping a stone across recent years


Early 2008, not long before the 2009 recession: Real GDP (blue) is right on track, and the track itself (Potential GDP, gray) is predicted to continue rising, undisturbed, for a decade:

Splash #1


Early 2010: In the past two years there was a recession (vertical gray bar). Real GDP (blue) dropped significantly, then turned upward again. In addition, Real GDP has been revised and now uses "2005 Dollars" rather than "2000 Dollars". 2005 Dollars are worth somewhat less than 2000 Dollars. It takes more of them to buy a given amount of Real GDP. That makes the blue line higher:

Splash #2a
For purposes of comparison, the above graph shows the "track" (Potential GDP, gray) as it was in early 2008. In point of fact, Potential GDP was also revised to use 2005 Dollars and, like Real GDP, is higher than it was before the revision:

Splash #2b
With blue and gray both revised, blue still appears to follow gray about as closely as it did before the revision, except since the 2009 recession. Also, for the future, gray appears to fall slightly below the path predicted in the previous graph, then return to it.


Late 2010: Ezra Klein examines the gap created by the 2009 recession. He looks at ways to to bring output back up to trend: Real GDP could accelerate quickly, or slowly, or not at all.

Splash #3


Early 2012: Pursuing Ezra Klein's third option, Real GDP (blue) continues on its new, lower path. Meanwhile, expectations have been somewhat reduced: The old 2010 trend (gray) has been lowered for 2012 (red):

Splash #4
In February John Taylor shows two graphs of recession and aftermath. One graph considers the 1982 recession, after which the recovery was like Ezra Klein's "rapid acceleration" model. The other considers the 2009 recession, after which the recovery is like the "no acceleration" model. But Taylor's graphs are not models. They are actuals.

That same month, James Bullard (PDF, 6 pages) offers a story to explain why we have a "no acceleration" recovery. In the years before 2008 our economy was in a bubble, he says. And the path predicted for our economy (gray, on Graph #1 here) was based on the bubble.

Imagine our economy without that bubble, Bullard says: predict a future path based on that lesser economic performance, and you will have a better prediction. In other words: Forget the Ezra Klein graph. We're not going to bring Real GDP up to trend. We're going to bring the trend down to meet Real GDP.

As I write this today (2017) Bullard's story seems reasonable, even to me. Bullard's is now the accepted story. How did we get here?


Late 2012: Scott Sumner says if the new (lower) trend continues he will "throw in the towel" and accept it:

In 2009 I advocated going all the way back to the old trend line. I currently favor going about 1/3 of the way back. If we keep on the same track for a few more years I’ll through in the towel and advocate starting a new 5% trend line from where we are.

Sumner, struggling to accept the lower trend.


2014: Marcus Nunes shows a graph of Real GDP since the 1980s, including the 2009 recession and the slower growth since that time. The graph also shows the old and new trends of Real GDP growth:

Splash #5
"For RGDP the trend growth rate is 3.3%," Nunes says. But "There´s no doubt that the economy was 'shifted down' during what has become known as the 'Great Recession', and it looks as if this shift is 'permanent'."

Yes, when the economy falls below trend, it is reasonable to assume that it will rebound back to it. The only thing is that the trend it will rebound to is the new much lower one. And that´s something that makes me think that there´s a wide acceptance of the new trend.

What this implies is that over time the “old trend” will, for all sorts of economic reasons, “cease to exist”, in fact coming down all the way to become one with the new trend level, in which the real economy grows at 2.2%...

Nunes worries that people will, like Sumner, forget about the old trend and accept the new one. There is wisdom in his words.


2016: “Is current output really 18% below potential output?” Menzie Chinn puts the question in quotes, suggesting he does not accept the 18% number. He explains:

One thing that should be remembered is that the trend line extrapolated from 1984-2007 implies that the output gap as of 2015Q4 is … -18%.

In other words, he says the 1984-2007 trend must be wrong. This graph, he says, "highlights the implausibility of the -18% output gap":

Splash #6
Menzie Chinn has turned a corner from Marcus Nunes. The old trend is unreasonable, Chinn says; therefore the new trend must be right.

His evidence? The long duration of the new, lower trend. Chinn enhances that duration by showing the new, lower prediction of Potential GDP, which conveniently aligns with the reported data. In fact, though, the new measure of Potential GDP is not better or more accurate than old measures of Potential GDP. Not better, only different. Lower.

And the duration of slower reported growth is not evidence that the old high trend was wrong. It may only be evidence that economists have not yet found the problem, and policy has not yet fixed it.

Marcus Nunes was right: The old trend has ceased to exist. People like Scott Sumner and Menzie Chinn no longer expect good growth to return. With their minds at last made up, economists can now go back to explaining the world making up their stories.

Saturday, May 27, 2017

Time for another update already


Thursday, May 25, 2017

Just to be sure


This graph (from yesterday's post) shows average growth rates for periods beginning in 1930. But the graph is a close-up. It only shows the years since 1952:

Graph #1
So the first point on the red line represents average growth for the 1930-1952 period. This seems misleading, as the years before 1952 are not shown. I want to re-do the calc, figuring average growth rates for the period beginning in 1952.

I'll keep the green line from the first graph, the "average annual growth" calculation from BEA. I'll toss the running average line, and make a new red line using the BEA calc on data from 1952 and after:

Graph #2


The new red line shows a lot of variation in the early years. That's to be expected, as there isn't much to average against. The green line has a backlog, 20 years of data from before 1952, acting like an anchor to prevent the green line from moving when the blue line moves.

In the early years the red line has no such backlog, so big changes in the blue line create big changes in the red. After a dozen years or so, the red has a backlog of its own. Then it is not so much influenced by changes in the blue. And then we see the red and green run side-by-side.

By the time the red and green run side-by-side, both are more influenced by their past than by each new change in the blue line. So if somebody says average RGDP growth in the 1947-2017 period is 3.21%, it tells us more about the past than it does about today.

On the other hand, if the side-by-side years show a general downward trend, it means there are so many below-average years that they are dragging the anchor down. I conclude, then, that the important information in these long-term averages is not that the average value is 3.21% or 3.3% or whatever.  The important information is that growth has been going downhill since the 1960s.


I go back to the first graph and this time keep the red line, the running average since 1930. I get rid of the green line and create a new one showing the running average since 1952. This time we compare running averages for two different start-dates.

Graph #3
This time the red line has an anchor, two decades of data from before 1952. The green line doesn't. So the green line responds more to changes in the blue than the red line does. But again, after a dozen years or so, the "since 1952" line has its own backlog, and we see red and green show the side-by-side behavior.

We get the same behavior for running averages as we got for the BEA calculation. It turns out that the "backlog" is more significant than the calculation that makes use of it. To me this says the long-run average isn't worth much, except it shows that new growth keeps dragging the average down.


To finish up, I'm replacing both lines on the first graph with the "since 1952" data.

Graph #4
Red and green follow the same path: decline since the 1960s.

// The Excel file

Wednesday, May 24, 2017

Decline of the long-run average


Today we look at long-run economic growth, and along the way compare the results of a running average calculation to a more complicated (but no doubt more accurate) calculation that the BEA uses to figure average annual growth.

The other day I read that the

GDP Growth Rate in the United States averaged 3.21 percent from 1947 until 2017

That reminded me of Marcus Nunes telling me

It´s more or less recognized that US RGDP is trend stationary (maybe that´s changed now!), with real growth averaging about 3.3% from the early 50s to 2007.

I'm not comfortable using averages that way. Compared to the economic growth of the last ten years, 3.21% average growth (1947-2017) seems quite high. And yet 3.21% is noticeably lower than Marcus's 3.3% for the period ending in 2007. It seems the more recent the end-date, the lower the average growth. I want to look at the numbers.

(Yes I know, the two long-term averages have different start-dates too. That's another reason I have to make my own graph!)

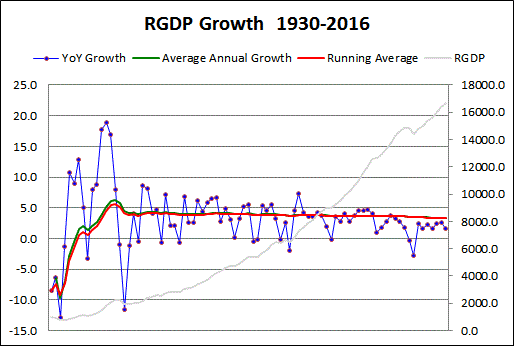
The first graph today shows Real GDP (annual data, faint gray, right-hand scale) along with annual growth rates (blue), an average of the growth rate values (red), and an average I got by using the BEA's "variant of the compound interest formula" (green):

Graph #1: On the right is where we have been recently. On the left is where we were before.
Both averages are figured for the full period to date. (The average for 1931 is based on the years 1930 and 1931; the average for 1975 is based on the years 1930 thru 1975; and the average for 2016 is based on the 1930-2016 period.) All the years since 1930 are included in each year's average.

I was happy to see there is not much difference between the red and green lines. No doubt the BEA's method is more accurate than a simple running average, but the running average looks like a good rough estimate. And the two lines seem to follow a similar path.

The blue line is up near 10% growth for a few years in the mid-1930s, and approaches 20% in the early 1940s. There are extreme lows before and after these extreme peaks. Then the next high after that has two dots a little below 10%. Those two dots represent 1950 and 1951. The second graph begins in 1952, and shows the same values as the first graph:

Graph #2: On the left is where we were before. On the right is where we have been recently.
Red and green run close together and show the same variations. Toward the right end, the green line is hidden behind the red, but both lines continue all the way to 2016.

Also, it is a little more obvious on this graph that average RGDP growth is in decline; red and green both show it. The averages ran at or above the 4% growth rate until 1980, then fell noticeably below the 4% rate.

Blue dots above the average pull the average up. Blue dots below the average pull the average down. The last blue dot above the average occurred in 2004.


//

The red and green lines never go as low as 3%. So for any year you pick, it wouldn't be wrong to say "The GDP growth rate in the United States averaged above 3.0 percent from 1952 until [year]". Sounds pretty good, right? Especially compared to the slow economy of recent years.

It is even true. But it is nonsense. Economic growth has been slowing. And the trend of growth has been slowing. The trend shows where the economy is going in the longer term.

You don't get a feel for where the economy is going when somebody says the average growth rate since 1947 is 3.21%. There were a lot of good years since 1947, that helped to bring the average up. That doesn't do us any good when we've been below the average for years. It's like you got an F on a test and your parents find out, and you tell them "Yeah, but the class average was a B!" That's not gonna help you.

And it doesn't give you a feel for where the economy is going when an economist says GDP is "trend stationary" at 3.3%. It doesn't even sound like things are going downhill. But they are.

// The Excel file

Tuesday, May 23, 2017

Comparing conclusions


From Time magazine, December 31, 1965
If the nation has economic problems, they are the problems of high employment, high growth and high hopes. As the U.S. enters what shapes up as the sixth straight year of expansion, its economic strategists confess rather cheerily that they have just about reached the outer limits of economic knowledge. They have proved that they can prod, goad and inspire a rich and free nation to climb to nearly full employment and unprecedented prosperity. The job of maintaining expansion without inflation will require not only their present skills but new ones as well. Perhaps the U.S. needs another, more modern Keynes to grapple with the growing pains, a specialist in keeping economies at a healthy high. But even if he comes along, he will have to build on what he learned from John Maynard Keynes.
 
From the Federal Reserve Bank of St. Louis Review, November/December 1998:
I am sure rigorous economic research of the kind Homer Jones advocated, directed, promoted, and carried out will be essential to developing and adopting policies to raise productivity growth and achieve such a goal. We need a new Homer Jones to help us find policies for economic growth just as we were lucky to have had the original Homer Jones to help us find policies for economic stability.