Clonal recommends
this interview with David Graeber, author of “Debt: The First 5,000 years”. In the intro to the interview (and in the related text) the speaker says that President Nixon, by taking us off gold,
began what anthropologist and author David Graeber says is the latest pendulum swing away from an economy based on hard currency to one based on virtual money, or credit, which can lead to debt spinning out of control...
Sounds reasonable, right? Well, I disagree. No surprise there, I guess.
If going off gold in 1971 is the reason debt went "spinning out of control," then I think we should see a noticeable increase in debt after 1971. We should see that increase
soon after 1971. And we should that increase get bigger over time, as debt gets more and more "out of control". Yeah, sort of like this:
 |
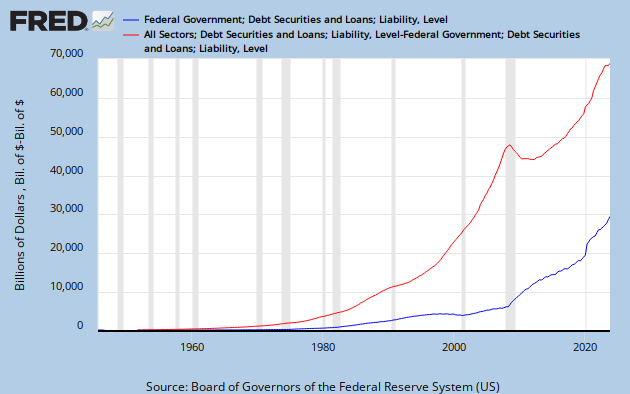
| Graph #1: Total Credit Market Debt Owed |
But the thing of it is, until the crisis, the blue line on Graph #1 was increasing
all the time. So of course it is higher at the end than at the start. And of course it looks worse after 1971 than before. Glancing at a line that "goes up" does not provide the strength of evidence we need if we are to accept the interview statement. Not for me.
On Graph #1 I highlight what looks like a temporary increase in the general pattern of increase. This distortion of the general pattern, like the swelling from a bug bite, begins in the mid-1980s and tapers off to nothing by the mid-1990s. What I'm looking for is a change that begins the same way, but never tapers off. If debt "spins out of control" because we went off gold in 1971, there is no reason for the increase to be temporary, and every reason to expect the increase to be permanent and to grow larger.
Furthermore, the timing of the temporary increase on Graph #1 is wrong. It does not come shortly after President Nixon took us off gold. It comes shortly after President Reagan started making changes to economic policy.
Still, Graph #1, overall, does show increase that looks like an "out of control" increase in debt. Yes, I agree that it does. But again, there is the timing problem, the absence of any change associated with the Nixon policy action. I am therefore forced to reject the view presented in the Graeber interview, that the growth of debt in our lifetime is in any way a consequence of "going off gold".
To finish that thought: I think "going off gold" was a policy response to conditions that demanded action; and I think the particular "condition" demanding action was the increase in total debt that had happened
before 1971. But that's just me.

Did "going off gold" create the debt problem? No.
Did going off gold make the problem worse? Yes and no. Going off gold
allowed debt to continue growing and therefore allowed the debt problem to grow worse. But going off gold did not
cause debt to grow worse.
As I have it, the mindset that thinks going off gold -- or any policy -- is "a good idea because it allows debt to continue growing" is the cause of the problem. That mindset has been the cause of the problem since the end of the second World War, and remains the problem today.

FRED provides TCMDO (Total Credit Market Debt Owed) numbers for every year from 1950 to 2010. Conveniently, the Nixon gold action occurred 21 years after the start-of-data. I broke up the FRED data into three periods of equal length: 1950 to 1970, 1970 to 1990, and 1990 to 2010. If going off gold was the turning point that allowed debt to "spin out of control" then we will be able to see this in the difference between debt growth before 1971, and after.
I used an old trick from Milton Friedman, and figured the debt numbers for each period relative to the period average. I think of this as making three separate graphs, for each graph finding the "center" of debt, and then stacking the graphs one on top of the other with the centers lined up. This way I can compare three 20-year increases in debt, and I am not befuddled by the fact that each subsequent increase starts where the previous increase left off.
I am looking for evidence that the Nixon gold policy of 1971 allowed debt growth to go "out of control", or that it did not. On the horizontal axis of the graph below, years are represented by the numbers "0" through "20". To figure out what those years are, add the year-number to the start date in the legend. For example, year "0" for the blue line represents 1950, for the red line 1970, and for the gold line 1990. Year "6" for the blue line represents 1956, for the red line 1976, and for the gold line 1996.
 |
| Graph #2: Comparing Three Periods of Debt Increase |
The blue line on Graph #2 shows the growth of debt for the first period, 1950 to 1970. This line starts out higher than any other, and ends up lower (except for the crisis effect in year "20", when the gold (2010) falls below the blue. The blue line shows the slowest rate of increase.
The red line shows the growth of debt for the second period, 1970 to 1990. This line starts out lower than any other, and ends up higher. It shows the fastest rate of increase. So far, Graph #2 seems to support the view that the Nixon action of 1971 did result in "out of control" debt growth. But we're not done evaluating the graph!
The gold line shows the growth of debt for the third period, 1990 to 2010. This line starts out extremely close to the blue (1950-1970) line. And it stays close to the blue line for the whole period:
extremely close from the "0" year (1950, 1990) to the "14" year (1964, 2004) before rising briefly and then collapsing in crisis.
The 1950-1970 period shows the slowest rate of increase. 1970-1990 shows the fastest. But then 1990-2010 shows an increase that is nearly as slow as 1950-1970. In other words, if Nixon's 1971 decision to separate money from gold had any effect at all, that effect dissipated by 1990. Given the profound significance of the Nixon decision, the effect of such an act would never dissipate, in my view. Therefore I must conclude that despite the significance of the Nixon decision, it had little consequence for the growth of debt.
Going off gold opened no floodgate. Going off gold, by itself, did not lead to debt spinning out of control.

As a point of interest, the red line starts out low
because it ends up high, and because we are "centering" each 20-year period on the others. So again, this confirms that the red line -- 1970 to 1990 -- shows more of an increase than either of the other two lines.
Looking at that red line, I see a kink (an increase) around year "7" and another around year "13". These are changes in the pattern of debt increase. Year "7" on the red line is 1977, six years after the Nixon move. Year "13" is 1983, three years after the election of Ronald Reagan.
In the years before 1977, the red and blue lines appear to run parallel, red perhaps increasing slightly faster than blue, but this is not definitive. I conclude that red and blue in these years (1970-1976 and 1950-1956) show essentially the same pattern of increase. So there was no "spinning out of control" after 1971. At least, not for several years after 1971.
Did the Nixon move contribute? Did it facilitate the growth of debt? Of course. It was part of a policy dedicated to the increase of credit use and the accumulation of debt. Evidently there were other parts to that policy as well, one around 1977, and one around 1983.
Evidently it was
always thought wise to use credit and to let debt accumulate:
 |
| Graph #1 repeated: Total Credit Market Debt Owed |
I think the apparent strength of Graeber's argument arises from the precision of the date he chooses as a turning point: A well-defined moment. How could he be wrong?
But he *is* wrong. He is wrong because he picks one moment and says that moment defines the start of the problem. He is wrong because the moment he picks is only one of many moments, moments of policy, moments when the idea was
this policy will allow debt to continue increasing, and that's good -- moments that could only lead to a very bad ending.
If there was any single turning point that opened the floodgates of debt, we would see a flood happen
after that point, and no flood before. There is no such point. Debt was always increasing, as the graphs all show. It was
always policy to encourage credit use and the accumulation of debt.
It is our
policy -- always encouraging debt -- that is the problem. And if you bristle at the thought, let me suggest that your reaction is typical. It is this view, your view, that leads again and again and again throughout history to the crises David Graeber describes, crises that must result from a policy of perpetual debt accumulation.


