%2C%2BLevel.PNG) |
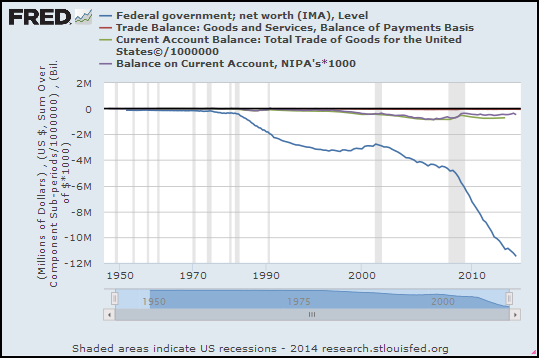
| Graph #1 |
I don't see balance sheets. I don't see arguments about how it's really a problem, or really not a problem. I don't see things like that. I see a line on a graph.
Impressions? Sure, I have impressions. My impression is that something is seriously different, before and after 1970. It looks sustainable before 1970, unsustainable after.
I don't think you look at this graph and say "every liability is somebody's asset". That's not an argument; that's a definition.
I think you look at the graph and say Okay, well, the Federal government has been doing something different since around 1970. Best case? Best case, the government has been trying to do good for us, pumping money into the economy, trying to make things better. You know: the "Keynesian" thing.
/// UPDATE 1:46 PM 24 August -- added graphs. Note: On these graphs, the height of the white-background graph area is less, because there are more series titles in the upper blue border. Because the height of the white area is less, the blue line looks smaller. But it's exactly the same data as in Graph #1.
No that can't be right. There's a big sag in the blue line on Graph #2. What the hell... Hey, I did these graphs quickly, but I didn't change the blue line. I bet it's another FRED glitch. I'll get back to ya. I'm supposed to be mowing the lawn...
 |
| Graph #2: Okay... the glitch on Graph #2 has to do with data frequency. The 10-year space between 1990 and 2000 on the graph is much larger than the 20-year space between 1970 and 1990. FRED would say I was careless with data frequency. I would say they should prevent this kind of error. For another example see my I don't know what that is, but it isn't GDP |
I was glad to see gray and green are similar. Makes me think that's a good one to use, either of those.
// REVISED GRAPH #2:
 |
| Graph #2 do-over: Just the Blue and Gray this time. Now the blue is as in Graph #1 |
The next graph Graph #3 shows the gray one as a percent of the blue one. (I did this one over, too):
 |
| Graph #3: Balance on Current Account as a Percent of Federal Government Net Worth |
Very interesting!

13 comments:
Lets remember that in 1971 I think, we closed the gold window. Not having this fixed exchange rate and instead a floating dollar probably did as much to affect the accounting as anything else. Seems to me that comparing the accounting before vs after the change in exchange rate policy is going to automatically incur some sort of "losses" after the change. e.g if my SS account was worth 1 million in pre 1971 dollars, a simple change in exchange rate may have made it "worth" 1.1 million the next day, and the govts accounting sheets must reelect that "loss". Not to mention the affect that varying the interest rate has had on govt liabilities over the years.
"Impressions? Sure, I have impressions. My impression is that something is seriously different, before and after 1970. It looks sustainable before 1970, unsustainable after."
Why don't we just think about this graph from the other side of the balance sheet?
That would mean non-Govt assets or net worth would be going up in a mirror image. And in seeing this rapid increase in the net worth of the non-Govt, would you then conclude that this is unsustainable? Or that things are worse because the non-Govt has too much net worth?
"I don't think you look at this graph and say "every liability is somebody's asset". That's not an argument; that's a definition.
"
But only showing 1/2 of the balance sheet misleads the mind of readers. If you want to be objective, you must acknowledge both sides of a balance sheet.
if every liability is an asset, then when i show liabilities i am showing assets. do i have to shit it out in a pile so you can see it?
And yes, I *do* conclude that the rapid increase in net worth if the nonGovt is unsustainable.
When did the dollar become the world's reserve currency?
This means incurring a large balance of payments deficit.
The "somebody else" in this analysis is at least partly on another continent.
And I don't think it was Keynesianism [which to me means expansionary spending] domestically as much as it was 1) tax cuts [which means increasing wealth disparity and reduced consumer spending] and more recently 2) austerity depressing the economy.
Alas
JzB
"But only showing 1/2 of the balance sheet misleads the mind of readers."
The whole concept of NET financial assets is equally misleading.
Financial assets come in different flavors. The different flavors are used as medium of exchange in different markets. The money used to buy groceries and gas or pay wages is not the same flavor as the money used to buy shipments of wheat, petroleum or copper in international markets. When you have an overabundance of one flavor over another that can lead to imbalances. For instance - inflated prices in commodities.
Jazz: "When did the dollar become the world's reserve currency?"
Oh I just read something on that:
...since the industrial revolution, there have been only two currencies that have led in international use: the U.K. pound and the U.S. dollar.
Until recently, historians focused on World War II as the turning point, with the pound prevailing before the war and the dollar thereafter. But a flurry of new research concludes that the transition occurred significantly earlier. While the pound was in the lead until 1914, the dollar rose rapidly in importance thereafter, with the two currencies sharing the principal role during the inter-war period.
From: To RMB or not to RMB? Lessons from Currency History at Money and Banking
"if every liability is an asset, then when i show liabilities i am showing assets. do i have to shit it out in a pile so you can see it?"
Please don't misunderstand me here. I'm not saying that YOU don't understand the dual nature of assets and liabilities.
I'm simply saying that this graph does not describe the nature of this relationship. And thats not your fault, the nature of mainstream economics is to fail to recognize the fundamental importance of balance sheets. And the Fed is nothing if not a mainstream neo-classical economic body.
"And yes, I *do* conclude that the rapid increase in net worth if the nonGovt is unsustainable. "
wrt your link, I disagree with the MMT scholars about the nature of savings desires. I think the "savings" that we can chart out can just as easily be a consequence of more income going to wealthier people who save more by definition. And then the official numbers would in no way represent the savings desires of the populace, its the old bill gates walks into a bar and makes everyone a millionaire on average problem.
As far as the unsustainability of Govt deficits (which become the Net financial assets of the non-Govt), what exactly do you find unsustainable about digital dollar entries at the Fed?
Greg: "Lets remember that in 1971 I think, we closed the gold window..."
Yep... I remembered that (and repressed it) while writing the post. Closing the gold window (as Milton Friedman called it) was probably the key change, opening the door and all that.
Still, things were happening before 1971, things creating the pressure that sort of forced Nixon's hand regarding gold. By "things" I mean bad policy, specifically the excessive reliance on credit.
The excessive accumulation of credit-created dollars meant there was a need to counterbalance those dollars by increasing government-created money. Going off gold allowed that to happen.
But then, once off gold, the increased monetary base allowed even greater expansion of credit-money.
I don't know if I can back this up with graphs. I'll have to look.
As I have heard the story told, what was happening pre gold window closing is that we were in danger of having to let go of large amounts of our gold as foreign creditors came a calling'. Because we only promised a gold exchange for certain maturity treasuries and many of these treasuries were held by foreigners a run on gold could occur and was about to occur.
So I don't know about reliance on credit policies but certainly it was an increase in imports that created this potential run. I don't think our household sector was nearly as indebted then but we were becoming used to having certain foreign produced products on our shelves/showrooms, straining our current account.
Auburn
I agree whole heartedly with your points about what these govt "losses" mean for the non govt. Which is why I air quoted losses. The neoliberal paradigm of evaluating a sovereign currency issuing balance sheet like it is a business is just................... absurd.
I would like to ask a neoliberal, so whose balance sheet can expand at will? Someones can. Its a necessity that someone be given the authority to simply create credits out of thin air, so who should get that.
I suspect they would say CBs which of course then begs the question, what is a CB in relation to a sovereign govt? Now we are retreading a very old discussion that has wasted pages and pages of space in comments sections the last 5-6 years. I know cuz Ive read most of them.
"Its a necessity that someone be given the authority to simply create credits out of thin air, so who should get that."
I don't think everyone agrees with that. IMO if we are going to give banks that power then commercial banks should be regarded as public utilities. Their profit margins should be limited and each chartered office should be required to lend only where it gets deposits (i. e. within its charter). Deposit accumulation is a flow into banks and loans are a flow out. Those flows are supposed to be equal. But when banks take deposits in one community and lend in another those flows are a pump that moves wealth out of the depositor's community. That is how you end up with situations like Detroit where you have an island of poverty in a sea of surrounding wealthy communities.
In the 1940's Detroit was a city of urban blue color homeowners. Banks funneling money out of Detroit is the main reason it was transformed into a city of poor renters.
jim
My point is that money itself was a concept created form thin air. It wasn't discovered, it was invented!
In any monetary economy someone can create more of whatever you are using to price things. It has to be that way. Otherwise its a zero sum game that can stop completely
I think I'm with Greg, if I'm reading him right. Before I'd even read through the comments the first thought that came to mind was our trade imbalance. Would love to see that plotted on this graph along the same time horizon, if that is possible, Art.
UPDATE: Graphs added... and done over, and added again.
Post a Comment