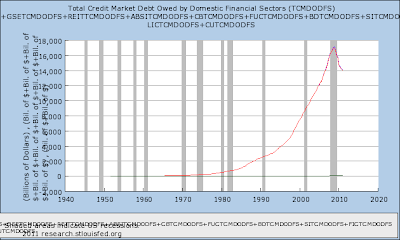
Looking at what I have to work with here, in the FRED debt data on my Shopping List (see previous post).
Debt owed by Domestic Nonfinancial sectors, plus debt owed by Domestic Financial sectors, plus "Foreign Sectors - Rest of the World..." add up to a red line that completely covers the blue TCMDO (total debt) line on this graph:
So that's a match. Foreign is a very small part of it, by the way.

Next: Find the components of the Domestic Nonfinancial debt.
Following the items on my shopping list, I include
- Household debt
- Federal Government
- State and Local Governments
- Farm Business
- Nonfarm Noncorporate Business
- Nonfinancial Corporate Business
Once again, remarkably, the components added together in the red line completely cover the blue line. The six components together equal total domestic nonfinancial debt.
Another match. So far, so good.

Next: Find the components of the Domestic Financial debt.
The shopping list includes "Commercial Banking" and what look to be three sub-sectors of commercial banking. I will test that assumption and if it holds, eliminate the sub-sectors from the components of Domestic Financial debt.
The sub-sectors are
- U.S.-Chartered Commercial Banks
- Bank Holding Companies
- Foreign Banking Offices in U.S.
With just the first two of these, the red line over-writes the blue for the recent years (since 2000) and also before 1980 (though in close-up, it might not).
The three components added together do completely cover the blue line:

Back to the components of Domestic Financial. Following the items on my shopping list, I include
- Agency- and GSE-backed Mortgage Pools
- Government-Sponsored Enterprises
- REITs
- ABS Issuers
- Commercial Banking
With these five in place, the red line has taken on the shape of the blue. But it peaks at $14 trillion, where the blue peaks at $17 trillion. So I keep going.
- Funding Corporations
- Brokers and Dealers
- Saving Institutions
- Finance Companies
- Life Insurance Companies
- Credit Unions
After adding these in, down to Finance Companies, the red line almost entirely over-writes the blue:
But the graph title and the key don't handle the long description well :)
With the next one I hit a brick wall. FRED reports:
Line 2 has the maximum of 10 data series added. You must remove a data series from this line before you can add another.
So I back up, and add a third line. I'll put the last two items into that line and if it rises negligibly above zero, I'll figure I have determined that there are eleven components of FRED's Domestic Financial debt.
Close enough.

And that's the Sunday morning exercise.


3 comments:
Thank you for this post. You made my day, I was looking for the components that made up TCMDO (total debt)and got to your page.
Thanks again for all your hard work and making it available for others.
Nice. Glad it was useful.
And thanks for the feedback!
An updated version of the second graph: the Components of Domestic Nonfinancial debt.
https://fred.stlouisfed.org/graph/?g=GpKz
First of all it's not called "debt" anymore. It is "credit" now -- seen, it seems, from the lender's point of view rather than the borrower's. Apparently it's a social hierarchy thing.
Second, there is no more "Farm Business" category. That "seems to have been merged into the nonfinancial corporate and noncorporate business sectors". Apparently it's a social hierarchy thing.
Third, most of the remaining five components have been renamed since I looked into it ten years ago.
The new graph adds up the components and displays them as a wide blue line, then shows the Domestic Nonfinancial Sectors data as a narrow red line. They follow the same path.
Post a Comment