A version of my "Debt per Dollar" graph, for Japan's economy:

Rise to 1990. Decline to 2002, Then very slow decline, almost flat. The trend line of the graph is comparable to Japan's economic performance, given that "the lost decade" began in the early 1990s and continues today.
Total debt in Japan has fallen by roughly two-thirds, relative to Japan's M1 money.
Wikipedia (20 July 2011) says the Bank of Japan defines M1 as "cash currency in circulation + deposit money". That's comparable in my book to what the St. Louis Fed says for the U.S. definition:
"M1 consists of: (1) currency outside the U.S. Treasury, Federal Reserve Banks, and the vaults of depository institutions; (2) traveler's checks of nonbank issuers; (3) demand deposits; and (4) other checkable deposits..."
So I think my use of M1 in a similar way for graphs of U.S. and Japanese data is satisfactory.
The debt numbers come from hbl at Thought Offerings, updated using currently available info from the Cabinet Office, as discussed earlier in this series of posts. The M1 numbers come from EconStats. (Annual data.)

What is the significance of the graph? It is too soon for me to say. But while looking for references to the phrase "the lost decade" I found two related graphs in Krugman's posts:
 |
| Source: Paul Krugman |
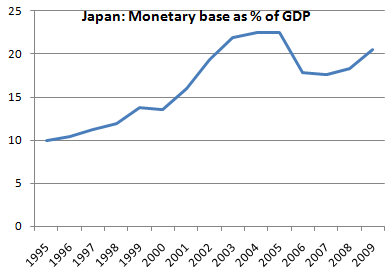
The Bank of Japan accelerated the growth of base money during the 2000s, as the Federal Reserve did in the early 1990s. (I draw no conclusion at this time.)
 |
| Source: Paul Krugman |
The rapid acceleration of base money had no noticeable effect on M2 money... And perhaps little effect on M1 money, if Japan's economy is anything like ours. My first graph here shows that a large drop in debt relative to base money (caused by a large increase in base money that you likely remember) had no effect on MZM (roughly equal to M2) and little effect on M1 money.
(I draw no conclusion at this time.)
// Update before posting.
I have been looking at this and other graphs of Japan data for a week now, and I am ready to offer a conclusion. The debt-per-dollar ratio (debt-per-yen in this case) has fallen substantially in the past 20 years. Low as it is, however, Japan's economy seems not yet to have picked up the pace of growth.
I conclude that the DPD is an excellent pre-crisis indicator, but it may be ineffective after the crisis.
I observe that Japan's DPD has fallen not because debt fell, but because the quantity of M1 money was pushed up to an absurd level -- greater even than the GDP!
I conclude that the necessary action is the reduction of debt.
So much is beyond question.
Furthermore, I want to conclude that it is private-sector debt which must be reduced. However, I may not have seen Japan graphs that make this conclusion inescapable.

No comments:
Post a Comment