From yesterday, base money during the Quantitative Easings:
 |
| Graph 1: Base Money |
Well, you'd think something must have happened because of all that QE money, right?
Something did happen. The money got added to excess reserves. Graph #2 shows base money in blue, as above, and excess reserves in red:
 |
| Graph #2: Base Money and Excess Reserves |
Or again, base money in blue. And in red, base money with excess reserves removed:
 |
| Graph #3: Base Money less Excess Reserves (in red) |
Base money less excess reserves shows a gradual uptrend. Almost like normal growth.

Finally, for the same period, excess reserves as a portion of base money:
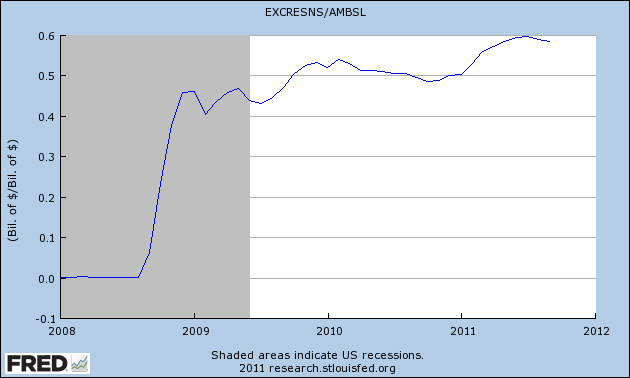 |
| Graph #4: Excess Reserves relative to Base Money |
The more they expand base money, the more it sits idle.

2 comments:
Good piece of work!
Base money less excess reserves shows a gradual uptrend. Almost like normal growth.
I take a closer look at that here.
Cheers!
JzB
Thanks!
Post a Comment