Monday, April 30, 2012

Two Stories


From The Atlantic of 27 April, The 2% Catastrophe: How One Number Explains the Miserable Economy, by Matthew O'Brien.

I don't like it. Part of the problem is attitude, the careless way O'Brien presents his ideas about fixing the economy. "The Federal Reserve is crucifying the U.S. economy on a cross of two-percent inflation," he writes. "The Fed has fetishized two-percent inflation," he writes. "Who's afraid of 3%?"

But the bigger problem is that his economic analysis is flawed:

If the economy is running too hot, the Fed raises interest rates. If it's running cold, it lowers rates.

For 30 years, this worked spectacularly. Recessions were rare and shallow. Inflation was low. Then 2008 happened. Even zero interest rates weren't enough to revive the collapsing economy.

"For 30 years, this worked spectacularly... Then 2008 happened." Yeah, but 2008 was where the economy was heading for 30 years. Matthew O'Brien overlooks that.

And those years were not spectacular. They were moderate. We had moderate growth, moderate inflation, moderate recessions, and moderate, jobless recoveries. And then those thirty years ended. Spectacularly.

It doesn't seem to matter to Mr. O'Brien why things were no better than moderate for so long. Nor does it seem to matter to him why the ending was spectacular. He doesn't even appear to see the connection between the long-moderating economy and its ultimate shutdown.

"If the economy is running too hot, the Fed raises interest rates. If it's running cold, it lowers rates," he says. But in the end, "Even zero interest rates weren't enough to revive the collapsing economy."

O'Brien's analysis is wrong. He leads us to imagine that the Fed pushed interest rates up and down in some kind of random walk, then dropped them all the way to zero in 2008. This is totally inaccurate. Interest rates trended down for thirty years. The walk was not random, despite the ups and downs. It was all downhill. Since 1981, it was all downhill.

Graph #1: The Federal Funds Rate

Since 1981 interest rates moderated, just like inflation, growth, wages, and everything else. Interest rates worked their way down as low as they could go. When they couldn't go any lower, they were no longer useful for boosting an economy that was "running cold". That made the economy unfixable, since interest rates are all we seem to know.

Not really the same story Matthew O'Brien tells, is it.

Sunday, April 29, 2012

Order and Balance


David Lawson reviews the new book Demand Side Economics by Alan Harvey, at Steve Keen's Debtwatch. Lawson quotes from the book:

This “Demand Side” economics is not new. It was originated and developed by the great British economist John Maynard Keynes... It is called Demand Side economics because demand is the fundamental driver of economic progress and constraint in economic stagnation... We describe and display the demand side framework by following its development through the thought of a series of influential economists, beginning with Keynes...

Okay, but let me point out two things.

Second, in The General Theory (1936) Keynes wrote: All production is for the purpose of ultimately satisfying a consumer.

First, in The Wealth of Nations (1776) Adam Smith wrote: Consumption is the sole end and purpose of all production...

Iterated.

But anyway, it seems to me that Smith and Keynes both are saying production and consumption ... supply and demand.

Balance in all things. Especially these.

Saturday, April 28, 2012

"It was private borrowing, not public borrowing, that created the mess."


From Paul Krugman's Leveraging, Deleveraging, and Fiscal Policy:

Spain and Ireland were running budget surpluses, not deficits, before the crisis. It was private borrowing, not public borrowing, that created the mess.

Yes, absolutely it was.

But, say some commenters, this was nonetheless malfeasance on the part of the authorities; they should have been running even bigger surpluses to offset the private credit bubble.

Does that work? No. If you look at a graph of private versus public debt, and think about how the trend fits with economic performance, this is where you end up:

When private debt is relatively low, it has room to expand. And when private debt expands, the economy grows well. But when private debt expands, it becomes relatively high. And when private debt is relatively high, it chokes off growth.

Graph #1: Total Nonfinancial Nonfederal debt relative to the Gross Federal Debt
The initial increase corresponds to the "golden age"
The post-1994 increase corresponds to the "macroeconomic miracle"

That being the case, the evidence says big government surpluses do not effectively offset big private deficits. Moreover, making the government surpluses bigger makes private debt relatively higher, and that only makes things worse.

Yes, it was private borrowing that created the mess.

Friday, April 27, 2012

Looking Failure in the Face

William T. Gavin

The St. Louis Fed's Featured Economist on 25 April morning was William T. Gavin, whose latest work is
What Is Potential GDP and Why Does It Matter?, Federal Reserve Bank of St. Louis Economic Synopses, Apr 20

Short PDF, page and a half, my kind of stuff.

Gavin says PGDP is a measure of the best we can do in an imperfect world. Fair enough. He says policymakers estimate PGDP by smoothing out actual GDP. And he admits that "the accuracy of our estimate depends on the accuracy of our long-term forecast."

He also points out the importance of PGDP: Policymakers use it to set policy.

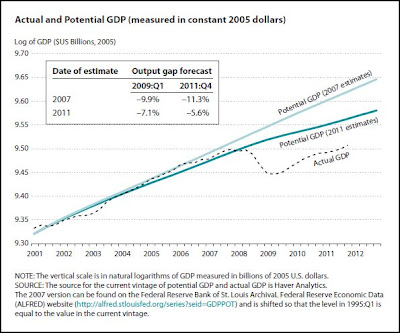
Gavin provides a graph showing two versions of PGDP: one from just before the crisis, and one from a few years after:

The higher level of potential GDP was estimated in 2007 and the lower level in 2011. The reduced 2011 estimate reflects the impact of sluggish GDP growth over the past three years.

Since they don't know how to bring conditions up to meet expectations, policymakers are lowering their expectations to match conditions.

Source: What Is Potential GDP and Why Does It Matter? (PDF)

See that box there on Gavin's chart? The box shows that the 2007 estimate was wrong by almost 10% in 2009, and by more than 11% in 2011. But the 2011 estimate was off by only about 7% in 2009, and by about 5½% in 2011. The implication is that the newer estimate is better: If the forecast is less wrong, it must be better, right?

Lest I am too subtle: The reason we study the economy is to make things better. Not to put the best face on failure.

Thursday, April 26, 2012

Private Debt 2012 (17): Cheap Talk


This story is told over and over again: Look how high the Federal debt is!

Blue Line: The Federal Debt as a Percent of GDP

But this story, inexplicably, remains untold:

Blue Line: The Federal Debt as a Percent of GDP
Red Line: Total Debt as a Percent of GDP


The blue line shows the same debt in both pictures.

Wednesday, April 25, 2012

Something's Missing


A second look at part of Bezemer and Gardiner's PDF from yesterday.

From the Introduction:

Thus, the study of monetary policies is not just the study of tweaking interest rates, of deciding on the rate of 'printing money', or of using taxpayers' money to bail out banks. It is the study of administering financial accounting processes on the macroeconomic level, differentiating between types of assets and liabilities.

Look at what Bezemer and Gardiner want to include in monetary policy:

  • tweaking interest rates
  • deciding on the rate of 'printing money'
  • using taxpayers' money to bail out banks
  • administering financial accounting processes on the macroeconomic level, differentiating between types of assets and liabilities

The reason I had to come back to this bit of the PDF is that something is still missing from that list.

"Tweaking interest rates." That's always what the Fed does, to get the inflation pressures where we want them, wherever that may be.

"Deciding on the rate of 'printing money'". That's the same thing.

"Using taxpayers' money to bail out banks". This is part of the response to the unusual circumstances.

And the last one, that's beyond my ken.

Bur here's the thing. For about as long as anybody has been alive, we have been using monetary restriction to fight inflation and credit-use to stimulate economic growth.

The problem is that we never change this application of policy tools. We always use tight money to fight inflation, and we always use easy credit to stimulate. This skews the playing field by reducing the quantity of money while expanding the reliance on credit, and it makes the economy's behavior increasingly unusual.

One of our basic assumptions is that printing money causes inflation. From this we come to believe that if there is inflation, there must too much money. Everyone seems to believe this. Economists and policymakers apparently believe it, for they pushed the quantity of money down relentlessly until the crisis. Even today, it is still about as low as it has ever been:


Graph #1: The Decline of Spending-Money

But fighting inflation is only half the story. Our policies also encourage credit-use, because we believe credit-use is good for growth. Again, the pressure was relentless, and nothing changed until the crisis:


Graph #2: The Rise of Credit-Use

The extreme changes shown on these graphs are results of policy. But you know, the problem goes just a little deeper than policy. What really must change are the flawed assumptions that underlie policy: the assumption that if there is inflation there must be too much money, and the assumption that credit-use is unfailingly good for growth.

It remains true that if there is inflation because there is too much spending-money, then the quantity of spending-money should be reduced. That is not true, however, if there is inflation because there is too much credit-use.

And it remains true that credit-use is good for growth when there is little credit-use. But when credit-use is already excessive, when debt is already excessive, increased credit-use is not likely to be an effective way to boost growth.

Even before policy can change, our basic assumptions must change.


So, what's missing from Dirk Bezemer's list? Let's go back to "tweaking interest rates" and stop there, and ask why we might tweak them.

Why tweak? To hinder growth and undermine inflation, or to encourage growth and end up with inflation. And what do interest rates affect? Interest rates affect the price of credit. And what is credit? Credit is the stuff that, when you use it, adds to your debt and creates future costs that will interfere with future economic performance.

What's missing from Dirk's list? Concern with the accumulation of debt.

Interest rates go up and down, up and down, up and down. But the accumulation of debt goes up, and up, and up. We ignore it at our peril.

What's missing from Dirk's list, as an essential component of monetary policy, is the need to keep watch on the balance between accumulating debt and the quantity of spending-money. Because you need spending-money to pay down debt.

Anything else you want to buy, you can put it on credit. But to pay down debt, you need spending-money.

Tuesday, April 24, 2012

A Roundabout Definition of Liquidity, and Other Things


It should be obvious that the rate of interest cannot be a return to saving or waiting as such. For if a man hoards his savings in cash, he earns no interest, though he saves just as much as before. On the contrary, the mere definition of the rate of interest tells us in so many words that the rate of interest is the reward for parting with liquidity for a specified period.


In a recent, short sequence of Gang8 messages I came upon a PDF by Dirk Bezemer and Geoffrey Gardiner: Innocent Frauds Meet Goodhart's Law in Monetary Policy.

The PDF relates the phrase "innocent frauds" to Warren Mosler and to Charles Goodhart, but connects it ultimately to John Kenneth Gallbraith. Quoting Galbraith to give meaning to the phrase, Bezemer and Gardiner relate it to "versions of the truth". One such would be the version I hold: money is a thing, not a relationship.

In Part 2 of the PDF, Bezemer and Gardiner state:

Three innocent frauds in monetary policy come together in a case study of the recent capital base enhancement by the UK government of Royal Bank of Scotland (RBS), and the wider issue of quantitative easing. The first innocent fraud is that money is a thing, not a relationship. But by lending, banks enter into a contractual relationship and there are limitations to what the newly created liquidity can be used for, as circumscribed by legislation. Liquidity creation by the government is not 'lent on' by banks to the public -- even though the image is that the government 'pumps money into the system' which then unclogs the credit pipelines to the economy.

The immediately next sentence in the PDF is "The second innocent fraud is that the government does this with taxpayer's money." So I'm thinking, what's in the whitebox here is an explanation of the reason that money is a relationship or, rather, the reason Bezemer and Gardiner think money is a relationship.

Short form: By lending, banks enter into a contractual relationship. Ergo, money is a relationship.

First off, I wish they would call it a "relation" rather than a "relationship". Relation refers to some kind of connection, as by blood or contract. "Relationship" suggests some kind of sexual adventure. Every time I read it.

So. By lending, Bezemer says, lenders enter into a relation with borrowers, and this relation, apparently, "is" money.

Nonsense. Let's go back to supply and demand. The potential lender has a supply of available credit. The potential borrower has a desire to put credit to use, a demand for credit. The two meet, perform contractual nookie-nookie, and money is born. Money is the offspring of the relation.

The relation between lender and borrower is this: The lender permits the borrower to put credit to use, in exchange for the promise to return the funds (plus interest) at some future date. The "credit" part is the belief that repayment will be made. The "debt" part is the obligation to repay. The money itself is neither of these.

Let me ask you this: What happens if the contract is broken, and the borrower never repays the lender, and, say, the lender writes it off as a loss. If that happens, the contract is terminated, right? The relation between borrower and lender is terminated. But the money continues to exist.

Is that right? If it is, then the money exists independent of the "relationship". And if the money continues to exist after the relationship is terminated, then the money is not a relationship: The money cannot be a relationship. The money is a thing.

Wow, that was easier than I thought.

Too easy, maybe. Look: The act of lending transforms available credit into credit in use, in exchange for a promise to repay with interest.

The transformation of available credit into credit in use is offset by the promise to repay. And the repayment will transform the credit again, making it again available. The money is a by-product of these arrangements.

Once the borrower spends the money, the money is no longer connected in any way to the borrower. Yet the borrower's obligation to repay remains, and the credit remains in use.

Money is a thing, not a relationship.

Monday, April 23, 2012

Notes on Labor


The PIMCO Equity Focus post ​Newtonian Profits offers analysis of economic conditions designed, it seems, with investors in mind. Not that there's anything wrong with that -- as long as the analysis is good.

Assessing "the vulnerability of profit margins", the article offers one item in particular that grabs my attention: "1. Increase in Cost of Labor". I want to split that item into two parts and consider both of them. Here is the opening:

Labor costs are about 70% of the total cost of production for corporations, according to Federal Reserve research. There is no question that if competition for a finite labor pool increased, this could put immediate pressure on corporate margins.

Seventy percent. Yeah, but it depends how you do the counting. Labor costs are nowhere near 70% of total corporate expenditure. There is a lot of double-counting that has to be not done, in order to reach the 70% number. But it isn't just counting. It is spending that is not counted. And spending is significant. Spending requires a medium of exchange. Spending creates demand. Spending helps to create inflation. Even when it's the spending we don't want to double-count.

Here is the balance of the item:

However, in the U.S. unemployment remains high, stuck at 8.2% as of March 2012, with 14.5% of Americans either out of work or looking for more work (source: Bureau of Labor Statistics). Obviously individual industries and companies may experience wage inflation due to scarcity of workers with specialized skills, but until unemployment falls closer to more normal levels, corporate margins do not appear vulnerable from a spike in unit labor costs. Last week’s disappointing jobs report highlights labor’s slow recovery.

Yeh.

It's funny, there at the end they call the jobs report "disappointing". But that report is the evidence that suggests profits will remain high, so how "disappointing" is that to PIMCO, really?

Anyway: until unemployment falls closer to more normal levels, corporate margins do not appear vulnerable from a spike in unit labor costs.

So if your plan is to solve the debt problem by creating some inflation, how are you gonna get wages to go up along with prices? It's the key question. Because if wages don't go up along with prices, then rising prices will just make things worse.

It's not rising prices that make it easier for us to pay down debt. It's rising incomes.


In related matters...

From Yahoo Finance, Inflation outpaces earnings, threatens spending:

WASHINGTON (Reuters) - Consumer prices rose modestly in March amid signs a spike in gasoline costs was ebbing, but inflation still outpaced workers' earnings and threatened to undermine spending.

Yeh, but inflation will solve the debt problem, right? Or so they say.


And this, from Bill Conerly's Businomics Newsletter of April 2012:


Sunday, April 22, 2012

Excess Reserves in Japan


The dark blue line (flat, near the 50000 level, with a step up in 2007) shows "Required Reserves (Average Outstanding).

The jiggy green line shows "Reserves/Outstanding at End of Period".

The light blue line (which tracks the jiggy green line) shows "Reserves/Average Outstanding".

The graph is from the Bank of Japan site; I started data selection here. Makes you appreciate FRED even more.

Dunno how the excess shown here compares to the excess at the Federal Reserve. But you can see that the excess evaporated quickly at one point. Probably why Bernanke is not too worried about excess reserves.

Saturday, April 21, 2012

João Marcus, thanks for writing


On the 20th I looked very briefly at NGDP targeting as presented by Marcus Nunes. Marcus gracefully responded, and now I have much to chew on. Or choke on, maybe. I will try to understand and respond by 4AM on the 21st.

Good thing I don't sleep much.

Marcus, sir... First: I think you are very good with graphs. I looked at your examples and was almost convinced by them, even before I understood what you were saying. But I find I must put you in the third person!

In your his first link -- “Change the tune” -- Marcus quotes Christina Romer...

The finding that monetary developments were crucial to the recovery implies that self-correction played little role in the growth of real output between 1933 and 1942.

...and responds:

This shows she´s a true believer in the power of monetary policy.

I like that. (There is more, both more from Romer and more reaction from Marcus. I'm quoting the parts I like.)

"Self-correcting" is not the best phrase for the occasion. It implies that the economy might change in ways that "correct" problems. And oh yes, I'm sure it does. But the things we think of as problems are not the same as the things the economy treats as problems. Mostly, the things we think of as problems are the economy's responses to things that are problems for it. Things like an imbalance in the money -- an excess of credit-use relative to the quantity of money in circulation -- which leads to stagnation and to inflation and to high unemployment, for example, and to large Federal deficits.

Evaluating Romer's article and reactions to it, Marcus writes:

Phillips Curve arguments don´t need to be evoked. Inflation can rise or fall with unemployment. What transpires depends on the kind of shocks that are hitting the economy at the particular time and, most importantly, whether MP is geared (explicitly or implicitly) to stabilize nominal spending.

So I want to say Marcus relies on shock theory. I don't think Adam Smith did. And I don't think Keynes did. And I don't, either. I still rely on supply and demand. An oil "shock" ought to boost oil prices, and oil profits, and lead to an expansion of oil supply. If it doesn't, and if it doesn't lead to energy diversification, then there are probably other problems at root besides "shocks". But that's just me.

So when Marcus gets more into shocks, fretting over the kind of shocks that are hitting the economy, I just hear an empty argument.

Marcus drives his train of thought from the Phillips Curve to a focus on gearing monetary policy ("MP") "to stabilize nominal spending."

I wouldn't do that. I would start with his opening thoughts:

Phillips Curve arguments don´t need to be evoked. Inflation can rise or fall with unemployment.

I would make sure you know that the term "Phillips Curve" implies a trade-off between inflation and unemployment. And I would make sure you know that when we say Inflation can rise or fall with unemployment, we are contradicting the implication of the Phillips Curve.

And I would say yes, Marcus is right: Events sometimes contradict the hundred years or more of empirical evidence supporting the implications of the Phillips Curve. And I would say the single most important question to be asked is: Why?

//

In the same post Marcus writes, "But only one thing “anchors” expectations and that is Fed credibility." He sees expectations as the cause of inflation, and credibility as the dampener. I'm sure there's a lot of support for such ideas, arisen in the last 40 years. I'm not impressed. The last 40 years has been all bad.

Show me Adam Smith focusing on expectations and credibility. Show me Keynes focusing on expectations and credibility. Yeah, Keynes wrote of animal spirits. But he said of expectations, that people generally expect existing conditions to continue. As a basis for macroeconomic theory, expectations is thin.

//

Marcus recommends his Figures 1 and 2 from the post. Both figures show, more or less, that the difference between NGDP and RGDP comes out as inflation. Figure 1 considers the Great Inflation. Figure 2 considers the Great Moderation. Marcus concludes:

If the Fed keeps nominal spending growth stable around a trend path, inflation will most likely remain low and stable and RGDP growth will evolve close to “potential”.

Sounds like magic to me. What I don't get is, what will drive the increase in real growth? What prevents the increased quantity of money from generating nothing but inflation? The only explanation I see so far is that we should try to mimic what happened during the Great Moderation, and we should expect that inflation and RGDP will respond as they did during the Great Moderation.

But what's behind the curtain? If Marcus is telling me, I don't see it yet.

//

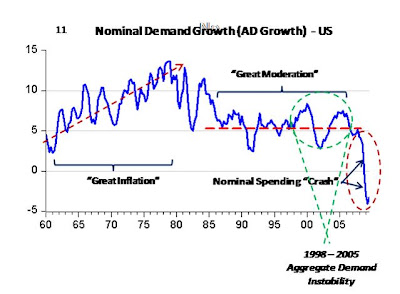
In his second link, The crisis from an AD perspective, Marcus wants us to look at Figures 11 and 12.

I was very quick with Marcus's first link. Perhaps he has a really good explanation there and I missed it because I was rushing too much. So let me take a different tack with his second link. It's a good one to take some time with. Marcus writes, "This one sort of lays down my views on NGDP LT."

"NGDP LT" is Nominal GDP Level Targeting. Somewhere in one of the posts he links, he points out that Level Targeting is better than Rate targeting because it follows a trend. And if you go off-trend, the trend continues to remind you of where you ought to be. And then policymakers should push to get back to the trend.

Dunno about that. The Bullard's Earthquake view is that the trend of potential output has suddenly fallen, and there is now a new and much lower trend. Seems to me Bullard would totally disagree with Marcus, and Marcus with Bullard. But anyway, Marcus writes:
Figure 11 shows the behavior of AD (nominal expenditure growth) in the US over the last 50 years. It is relatively straightforward to associate this behavior to the periods that became known as “The Great Inflation” and “The Great Moderation”.


In the 1960´s and 1970´s the focal variable was the unemployment rate. During the Kennedy-Johnson administrations AD shocks, from MP and Fiscal Policy (FP), parted a positive bias to AD growth.

In the 1970´s, characterized by negative supply shocks (notably oil prices), increases in AD to compensate for the negative effects of the shocks on unemployment and RGDP growth resulted in high and rising inflation.

Shock theory, again. Y'know what? Let me jump back to one of Marcus's comments on mine of the 20th. He quotes me:

I think other factors are involved in the rise of inflation and the decline of GDP.

And he responds:

If you are thinking that the first and second oil shocks are among those "other factors" involved, think again. The oil rise was a consequence of the (previous) rise in inflation!

Oh, yeah. I know. Marcus is saying that there were inflation troubles before the oil shocks of the 1970s. But if we jump back to the whitebox excerpt above, Marcus seems to say that inflation was a result of the policy response to oil shocks. Is there some contradiction here?

//

One more point from Marcus's second, and that's it for tonight. I'll leave out the Figures and just quote the text:

As indicated in figure 3, in mid 2006 house prices began to fall. From this moment the delinquency rate began to grow affecting the health of important financial institutions. A few (New Century Financial, for example) went broke already at the
beginning of 2007.

Notable, however, is the fact that between 2006 and mid 2008 AD growth was kept relatively stable and close to the trend path. Therefore, in spite of the crisis, the adjustments in the economy were able to proceed in an “orderly fashion”.

'Nother words, when Aggregate Demand growth is kept fairly stable (as under NGDP Targeting) the economy can weather severe financial troubles. That's interesting. Not sure it's safe to generalize from one example, but it's interesting.

//

Okay, it's almost midnight and my eyes are starting to cross. Marcus linked to another post, but maybe I'll look at that one separately.

I'm out.

Friday, April 20, 2012

Gimmick of the Week: NGDP Targeting


The interesting Marcus Nunes quotes Krugman:

And what this says is that price stability isn’t an adequate guideline for monetary policy. You can have stable prices and a persistently depressed economy.

Then he juggles the meaning of "price stability".

Then he forces his conclusion:

If the Fed has the power to provide a specific definition of “price stability”, it can also establish an alternative nominal target that the Fed would pursue in order to provide NOMINAL STABILITY, which is the most it can accomplish, anyway. The pay-off is that nominal stability will most likely translate into REAL STABILITY (of both real growth and employment), just like during the “Great Moderation”. Probably the best such target would be an NGDP Level Target.

Nominal stability will most likely translate into real stability. Says who? Nunes? Hey, I think he's interesting, but I don't think he's psychic.

NGDP targeting is a plan to assure that GDP increases at a constant rate, by providing as much inflation as necessary to achieve that goal.

Remember the Krugman quote that Nunes started with? Well, if you can have stable prices and a persistently depressed economy, then you can have inflating prices and a persistently depressed economy. Heck, we've had that now for as long as anyone can remember. You have to have lived in the 1950s and 1960s to have experienced a good economy.

There is no guarantee that deliberately inflating GDP will translate into real growth. There is no assurance, other than Marcus Nunes' prediction.

It looks to me like inflation started out low in the 1960s, when real growth was high. But during the "Great Inflation" of 1965-1980, real growth trended slightly downhill and inflation climbed a lot. And then after 1982 when inflation started coming down, real growth went up again.

Graph #1: Real GDP Growth (blue) and the Rate of Inflation (red), 1960-1990

Just how it looks to me.


For the record, I do not think my graph here makes a particularly strong argument. (I think other factors are involved in the rise of inflation and the decline of GDP.) However, a graph always makes a better argument than does unsupported prediction.

Mine is weak. There are other factors involved, factors which contribute to both the decline of growth and the upward pressure on prices. Of course, if such factors exist and NGDP Targeting ignores them, NGDP Targeting cannot succeed.

Maybe mine is not so weak, after all.

Thursday, April 19, 2012

There must be a better way


Following up on my 5 AM post, this graph from The Economist:


As the key shows, green represents the lowest levels of debt.

Which countries are in green? Brazil, Russia, India, and China.

All four are doing well, and three of the four are among the world's fastest-growing economies, according to this map from IndexMundi:


In a world that relies on credit for growth, the best growth is achieved when debt is not yet excessive, so that debt may grow rapidly and eventually become excessive.

There must be a better way.

Core Concept Validated Again: China


From Alwaysland:

The core concept of Arthurian economics is that the cost of interest -- the factor cost of money, to put it in terms Adam Smith might use today -- consumes so much out of wages and profits that our economy just doesn't work any more.

From Ouch, yuck, gasp, thud:

After World War II, the Federal debt was large compared to private debt. Private debt was small and did not interfere with growth. So the economy grew. And over the next 40 years, private sector debt grew until the cost of it started to interfere with growth. Since then, economic growth has not been good... except briefly, in the late 1990s.

From Another Piece of the Puzzle, regarding the 1990s:

So we have a decline in credit-use, and an increase in the quantity of money. And after 3 or 4 years of that, we get a "golden" decade. Coincidence? Not in my book.

From a comment:

We have to change the policies that cause us to use credit for money. Most important, we need policies that accelerate the repayment of debt. After that, everything else falls into place. The Fed can be less restrictive without creating inflation, because the repayment of debt is an anti-inflation policy.

From Red Shift:

Here is what I know to be true:


The quantity of money reached a peak in 1946 and has been falling since. The volume of debt pyramided on money hit bottom in 1947 and has been rising since.

Got the picture? Not enough money and too much debt is the kiss of death. If you want to prevent money from creating problems in your economy, you have to have enough money and not a lot of debt.

Now, here's the situation in the U.S. and China:


The numbers are from the CIA World Factbook, taken 14 April 2012. As tabulated in my 3AM post.
Google Docs spreadsheet available.


Private Debt 2012 (16): Why do you think that?


Why do you think it is the Federal debt that hinders economic growth? That's just silly. It is private debt that hinders private sector growth.

A new use of credit creates an addition to spending and a boost to the economy. But the equal and opposite effect is the drag on the economy, resulting from the debt that was created by that use of credit.

It isn't magic. We don't get something for nothing. We get something when we borrow, but in exchange we create debt, a drag on the economy.

So if we go for 60 years borrowing more and more, the debt just accumulates. The drag from that debt accumulates, too, slowly but surely becoming an insurmountable obstacle to economic growth.

People say taxes are high, and still the government has deficits, so government spending must be excessive. I disagree. Taxes are high, and the government has deficits, and small government as a rule is better than big government, sure. But there are other economic forces at play and other economic factors to consider.

Taxes must be higher in China than they are here, don't you think? And the government must certainly be a bigger part of their overall economy. But China has been growing like crazy for a long time, and we have not. There are other economic forces at play and other economic factors to consider, other than Federal spending and Federal debt.

China has less private debt.

From your friends at CIA...


ECONOMY :: CHINA UNITED STATES
GDP (purchasing power parity): $11.29 trillion (2011 est.) $15.04 trillion (2011 est.)
GDP (official exchange rate): $6.989 trillion $15.06 trillion (2011 est.)
GDP - real growth rate: 9.2% (2011) 1.5% (2011 est.)
Labor force: 816.2 million 153.4 million
Unemployment rate: 6.5% (2011 est.) 9.1% (2011 est.)
Budget: revenues: $1.646 trillion revenues: $2.264 trillion
Budget: expenditures: $1.729 trillion (2011 est.) expenditures: $3.604 trillion
Taxes and other revenues: 23.6% of GDP (2011 est.) 15% of GDP
Budget surplus (+) or deficit (-): -1.2% of GDP (2011 est.) -8.9% of GDP (2011 est.)
Public debt: 43.5% of GDP (2011) 69.4% of GDP (2011 est.)
Inflation rate (consumer prices): 5.4% (2011 est.) 3% (2011 est.)
Stock of narrow money: $4.599 trillion (31 December 2011 est.) $1.943 trillion (31 December 2011 est.)
Stock of broad money: $13.52 trillion (31 December 2011 est.) $12.14 trillion (31 December 2010 est.)
Stock of domestic credit: $10.72 trillion (31 December 2011 est.) $32.61 trillion (31 December 2009 est.)

From the CIA World Factbook.

Of course they provide two versions of GDP and don't tell me which one to use. I looked up PPP but that went nowhere. I went out with FIDO3 (now FIDO2) and decided to go with the "official exchange rate" version, as that is probably "official".

Eventually it occurred to me to see what numbers FRED uses. I typed China in the search box and found EXCHU, the (monthly) China / U.S. Foreign Exchange Rate. Over on the side FRED reported, among the Latest Observations, the value 6.3482 for the last month of 2011. (The CIA data are 2011 estimates. 6.3482 is close enough for me.)

And I found CHNGDPNADSMEI (nice, huh?), the Current Price Gross Domestic Product in China, reported in Billions of Chinese Yuans.

I divided that whole series by 6.3482 to convert it to dollars at the late-2011 exchange rate. (Only the late 2011 GDP value would be accurate, but that is all I need.) (Anyway, the China GDP series only goes thru 2010. I'm just looking at the last number and figuring it's close.)

Something over $6 trillion. That's the "official exchange rate" number, not the PPP number. Yeah, I'm going with that.

Purchasing Power Parity


From Wikipedia, the free encyclopedia:
In economics, purchasing power parity (PPP) asks how much money would be needed to purchase the same goods and services in two countries, and uses that to calculate an implicit foreign exchange rate. Using that PPP rate, an amount of money thus has the same purchasing power in different countries...

The idea originated with the School of Salamanca in the 16th century and was developed in its modern form by Gustav Cassel in 1918. The concept is based on the law of one price...

An example of one measure of law of one price, which underlies purchasing power parity, is the Big Mac Index, popularized by The Economist, which looks at the prices of a Big Mac burger in McDonald's restaurants in different countries...

Okay, that's the setup. Now the punch line:
This index provides a test of the law of one price, but the dollar prices of Big Macs are actually different in different countries. This can be explained by a number of factors: transportation costs and government regulations, product differentiation, and prices of nonfood inputs. Furthermore, in some emerging economies, western fast food represents an expensive niche product price well above the price of traditional staples—i.e. the Big Mac is not a mainstream 'cheap' meal as it is in the West, but a luxury import for the middle classes and foreigners. This relates back to the idea of product differentiation: few substitutes for the Big Mac allows McDonald's to have market power. Countries like Argentina that have abundant beef resources see a structural underpricing in the Big Mac.

In other words, the "law of one price" does not hold. Oh, of course, all the failures can be "explained". But none of the explanations can assert that the law of one price holds. They can only explain why the law does not hold.

Now, if the law of one price does not hold, and "purchasing power parity" is based on that law...

Do you see where I'm going with this?

Wednesday, April 18, 2012

Not Enough Foresight, Even in Hindsight


In a post titled Not Enough Inflation, Paul Krugman writes

Indeed, a bit more inflation would be a good thing, not a bad thing...

For one thing, large parts of the private sector continue to be crippled by the overhang of debt accumulated during the bubble years; this debt burden is arguably the main thing holding private spending back and perpetuating the slump. Modest inflation would, however, reduce that overhang — by eroding the real value of that debt — and help promote the private-sector recovery we need. Meanwhile, other parts of the private sector (like much of corporate America) are sitting on large hoards of cash; the prospect of moderate inflation would make letting the cash just sit there less attractive, acting as a spur to investment — again, helping to promote overall recovery.

I'm happy to see Krugman remind people that the "debt burden is arguably the main thing holding private spending back and perpetuating the slump."

I can see that inflation reduces the burden of existing debt -- if wages go up, that is, and not just prices. And if new additions to debt don't undermine the process.

I can see that calling it "modest" inflation makes it seem more reasonable.

I can see that inflation would tend to convince hoarders to come out of hoarding. I do find it troubling that we seem to need a negative return to money, to make investment more appealing.

But the main thing I see is that Krugman is basing his policy suggestions on outcomes, rather than on the problem that gave rise to those outcomes. And he knows perfectly well what that problem is: private debt.

There's no "arguably" about it.

Tuesday, April 17, 2012

Eventually, there is no alternative


When I first got on the internet I ran across an innocent-sounding statement. Someone had distinguished between greenback dollars and account-entry dollars, and thought greenback dollars rare and therefore valuable. The account-entry dollars, they thought, would continue to grow and increase and inflate away, while the greenback dollars would only grow in value.

It was a unique idea -- I've probably presented it badly -- and fascinating.

Immediately, some cowboy misunderstood the innocent statement and with Austrian bravado blew it out of the water. Naturally. But the idea stuck with me, and woke me up this morning.


After the gold standard had failed one time too many, people invented the Federal Reserve to provide a more flexible monetary system. Eventually, the printed dollar became a replacement for gold.

But if you mentally equate olden-day gold with modern-day central bank money, the old and the new face an identical challenge. That challenge is the creation of credit-money by private banks.

Under the gold standard, no central authority had control over the quantity of money. FDR's devaluation of the dollar to $32/ounce was an attempt at centralized control. But it came late, it worked only temporarily, and FDR has still not been forgiven for doing it.

Today, the central bank has control over the quantity of money but the solution (as with FDR) is always to inflate. The problem now, as then, is that the quantity of money (be it gold or central bank issue) becomes insufficient to support the quantity of private bank credit -- because of the growth of private bank credit.


Given the option to inflate, we inflate. When private issues overwhelm central bank money the economy is hindered, and the central bank responds by inflating the quantity of money.

To the extent that it outpaces the growth of private credit issue, inflation of the base money can reduce the hindrance. But the result is price inflation.

That is what happened during the 1960s and '70s. Then in the 1980s a new policy was established, which controlled prices by undermining demand, while still celebrating finance. But it is not wise to mess with the forces of supply and demand. And interest rates over the next thirty years worked their way down to zero, whence they could fall no more.

And now the only solution our central banks can see, to correct the imbalance between central bank money and private bank credit, is to issue more central bank money. Thus, quantitative easing.

Both the problem and the solution today are just as they have always been: the growth of private credit use and private debt.


The Federal Reserve will ultimately realize that increasing base money does nothing to restore economic vigor but only increases inflation and the threat of inflation. At that point, they will stop.

Wikipedia:

A commercial bank that maintains a reserve account with the Federal Reserve can obtain notes from the Federal Reserve Bank in its district whenever it wishes.

Eventually, the Fed will refuse to issue greenbacks in exchange for account-entry dollars. Eventually, they will fail to honor their obligation to convert reserves into currency on demand. Eventually, they will have no choice.

At that point, the cowboy will be proved wrong, and the innocent proved right. But by then, it will not matter. It will be too late.

Monday, April 16, 2012

If you do not look, you can not see


At Wikipedia, the U.S. "public" debt is the debt of the Federal government (as opposed to state and local governments). It includes both "Debt held by the public" (which is included in FRED's TCMDO as FGTCMDODNS) and "Intragovernment debt" (which is not part of TCMDO, but is included in FYGFD and also GFDEBTN).

GFDEBTN shows quarterly data, but only goes back as far as 1966. FYGFD only shows annual data, but goes back to 1939. At first, I didn't notice the late start of GFDEBTN, and used that data to produce this graph comparing "Public" debt to "Other" (non-Public) debt:

Graph #1: The Public Debt as a Percent of the Rest of Debt, since 1966

Wow! -- It's all over the place. The Total Public Debt (converted to billions) relative to all the other debt in our economy, and expressed as a percent.

But this is not the first time I've looked at these graphs, and the picture shown in Graph #1 was not the picture I was expecting. That's when I looked closer and noticed that the numbers don't start until 1966.

BTW, 1966 is the year I graduated high school, and I can still remember that far back. Heck, I remember thinking the '66 Pontiac GTO was a dream car. The price of gasoline back then was, I don't know, maybe 32 cents a gallon? Those days are gone. Pontiac is gone now, too.

Interesting thing about Graph #1. Despite 4, 5 years of private-sector deleveraging, and despite 4, 5 years of earth-shattering Federal deficits, the level of Public debt today, the most recent level shown, is no higher than it was in the mid-1990s (just before the "macroeconomic miracle"). And it is lower today than it was in 1966. Public debt, relative to all the other debt in our economy.

But 1966 has us already into the so-called Great Inflation, and approaching the end of the so-called Golden Age. Graph #1 shows mostly troubled times for our economy. So I did the graph over, this time using FYGFD, to see as many years as possible:

Graph #2: The Public Debt as a Percent of the Rest of Debt
This graph shows the same relation as Graph #1. It just shows more years. But you can see that the high point around 2010 appears on both graphs. You can see that the high point of the mid-1990s appears on both graphs. And you can see that the high point of 1966 on Graph #1 shows up on Graph #2 as a point higher than everything else that comes afterwards.

What Graph #2 shows, which Graph #1 does not, is that the decline from the 1966 high is really a decline from the much higher level in 1950 (or before). So you have to go back to Graph #1 and re-imagine it to see the blue line falling from way-high up, falling, and falling to its 1966 level, and continuing to fall then as the graph shows, until 1974 when it takes its first significant bounce.

If you only look at the graph for 1966 and after, a lot of important info is left out.

The Public debt declined until 1974 when it reached a low of 25% of "other" debt. If we take Graph #2 and flip it over and look at "Other" debt relative to the Public debt, we will see "Other" debt rising until 1974 when it reaches four times the level of the Public debt.

Graph #3: The Rest of the Debt as a Multiple of the Public Debt
Debt other than the Public debt increased from approximately equal to the Public debt in 1950, to four times the Public debt in 1974. Since that time it has been variable at a high level.

That's when things went bad, 1974, because of the massive accumulation of debt other than the public debt. That was the end of the Golden Age, and the midst of the Great Inflation. Since that time, the economy's performance has been variable, at a low level.

A lot of people say we must reduce the Public debt. Just about everybody else says yeah, but to do that we must first increase the Public debt. I say hey, why don't we just reduce "Other" debt through some kind of massive debt forgiveness?


A post at Economic Logic, titled Increasing public debt is a consequence of financial liberalization and inequality opens with this premise:

The current debt crisis is the culmination of a long process of public debt accumulation over the last three decades in developed economies.

I challenge the premise.

The current debt crisis is the culmination of a long process of private and other non-public debt accumulation until 1974, when the economy broke under the burden of that debt. Since that time both Public and Other debt have grown more rapidly, but this growth has not solved the debt problem.


Related post: How the Scientist Thinks

Sunday, April 15, 2012

Ouroboros and Irony


To solve a problem in computer programming, you break the problem down into smaller parts and solve each part separately.

That technique works very well.

To solve the problem of debt, it seems to me, many people like to break the problem down into small parts and then say: Look! There is no big debt problem!

That technique doesn't work.

I'm pretty confident that finance grew because productive-sector profits were declining, making finance relatively more attractive. And I am fairly confident that financial costs are the primary contributor to declining productive-sector profits. Ouroboros. It becomes necessary to reduce the size of the financial sector so that the productive sector can grow. Irony.

But I distrust the notion of putting limits on finance. Sht runs downhill, and soon those limits will be on me. The US Congress is not wiser than the Roman Senate, nor less self-interested.

If we -- the nonfinancial sector -- use half as much credit, the financial sector will shrink. The easy way to use half as much credit, without hindering growth, is to pay off old debt. Continue with the new uses of credit that become spending and create growth, but accelerate the repayment of debt to reduce the total demand for credit.

I keep coming back to the question that if we just need credit for growth, then why do we need credit use at 350% of GDP? And I keep coming back to the observation that there is nothing natural about the size of the debt accumulation we have achieved. It must be a result of policy.

Yes, I want to achieve the same thing that can (presumably) be done by imposing limits on me. But my plan of attack is different, and my thinking goes all the way back to the rudimentary assumptions that underlie policy.

I want more fiat money in the economy to make up for the reduction of credit use. (That's the whole plan.) But the quantity of fiat money has been reduced (see: M1/NGDP) while our use of the more expensive credit-money has increased. The quantity of fiat money has been reduced because of our assumption that printing money causes inflation.

Meanwhile, our use of credit has increased -- leading to the bizarre accumulation of debt -- because of our assumption that credit use is good for growth. (See "irony".)

Saturday, April 14, 2012

Velocity


From Asymptosis:

There’s about $10 trillion in MZM right now, and GDP (annual spending) is at about $14 trillion.* The money stock turns over about 1.4 times per year.

and this important footnote to the $14 trillion:

* Note that this does not include spending on intermediate goods — those that are turned into final goods within the accounting period — or used stuff. Adding these into total spending when calculating velocity might yield interesting insights. See Nick Rowe, Macroeconomics and the Celestial Emporium of Benevolent Knowledge.

GDP counts only "final" spending. Basing the velocity calculation on GDP is like figuring your average speed during a cross-country trip, based on the time and distance of the last mile of the trip.

If you want a realistic measurement of how often the average dollar is spent, you must consider all the spending that occurs in a given period of time. I have an acronym for that: TEA, or Total Economic Activity. There is no such measurement in the statistics.

Quite frequently in newspaper articles you can find GDP described as "total economic activity." That is an error.

Friday, April 13, 2012

Land, Labor, Capital, and Finance


A post by Gunnar Tomasson of Gang8, on the Keen-Krugman dispute. Most of it escapes me. But not all:

Back to Samuelson. On another occasion in the late 1970s, I wrote to him and stated that it was logically impossible to integrate money into a unified general equilibrium framework because NO real factors of production were involved in the supply of modern (electronic) money.

In other words, something which cost nothing to produce could not in principle be placed in an equilibrium setting with something whose production required inputs of real factors of production (labor and natural resources).

Forget the context. Or, go read it. Whatever. I need to focus on a detail.

Tomasson says no real factors of production are involved in the supply of modern money, and money costs nothing to produce. I think he refers to the central bank's ability to create money by 'pushing a button on a computer'.

By contrast, credit or bank money does involve real factors of production. Those are the factors Thomas Philippon has in mind when he says, "The sum of all profits and wages paid to financial intermediaries represents the cost of financial intermediation."

But wages are wages, and profits are profits. Apart from those payments to labor and capital, there is the payment to finance: interest.

And, you know, if you have a few dollars in savings and earn just a few pennies interest on that money, to that extent you are part of finance.
If we say excessive finance is the problem then you are not part of the problem, for your few pennies are not excessive, certainly. Not to worry about that.

In TWON, Book 1, Chapter VI, Adam Smith wrote:

When those three different sorts of revenue belong to different persons, they are readily distinguished; but when they belong to the same they are sometimes confounded with one another, at least in the common language.

I think of myself as a workingman; my neighbor thinks himself a capitalist. Both of us to some extent receive interest income. The sources of revenue are often confused.

Smith didn't include finance among his sorts of revenue, but I do. Interest is not the same as wages, not the same as profit, and not the same as rent. Therefore there must be a separate category into which interest costs resolve themselves.

At the start of capitalism -- Smith's time -- finance played a very small role. At the end of capitalism -- our time -- it plays a very large role. The cost Smith overlooked was negligible. Today, we can no longer afford to overlook the cost of finance.

Thursday, April 12, 2012

Holding that thought


Just came across this old comment from Clonal:
Art,

You said,

the burden of debt declines when there is inflation

That is true only if I do not take on more debt with time, and my income keeps up with inflation

Absolutely true, and extremely important. I have come to rely on this thought more and more in the months since I read it.

Private Debt 2012 (15): $870B + $693B + $730B + ...


From the CONVERSABLE ECONOMIST:

There are two kinds of news stories about student loans. One group of stories emphasize the huge total of student loans. Calculations from the New York Fed for the end of 2011 find: " The outstanding student loan balance now stands at about $870 billion, surpassing the total credit card balance ($693 billion) and the total auto loan balance ($730 billion)." The Student Debt Loan Clock, which for illustrative purposes continually updates the total student loan debt outstanding, is on the verge of crossing $1 trillion.

The second group of stories emphasize the problems of particular students who have large loans and great difficulties in paying them back...

The outstanding student loan balance now stands at about $870 billion, surpassing the total credit card balance ($693 billion) and the total auto loan balance ($730 billion)

Some things cannot be said often enough. Excessive private debt is the problem.


Timothy Taylor is the Conversable Economist and the Managing editor of the Journal of Economic Perspectives, based at Macalester College in St. Paul, Minnesota, which can be read free on-line courtesy of the American Economic Association.

In the linked post, he writes

Sometimes student loans pay off; sometimes not. What facts and concerns should the average student thinking about such loans be keeping in mind?  Christopher Avery and Sarah Turner tackle this question in "Student Loans: Do College Students Borrow Too Much—Or Not Enough?" in the Winter 2012 issue of my own Journal of Economic Perspectives.

Taylor considers some of the issues raised in the article:

Most students are borrowing amounts that are within standard loan guidelines

"My own guess," Taylor writes, "is that part of what is happening here is that larger loan burdens are being offset by lower interest rates, so the overall ratio of loan payments to income has risen by less than one might otherwise expect."

The median level of student borrowing isn't excessively high.

He quotes from the article: "Examples of students who complete their undergraduate degree with more than $100,000 in debt are clearly rare: outside of the for-profit sector, less than 0.5 percent of students who received BA degrees within six years had accumulated more than $100,000 in student debt."

Students considering loans should think about the typical employment and pay prospects for that major.

Taylor: "I do think that many students agonize a little too much over their major, while not agonizing enough over the extent to which they are building a skill set."

That struck me as a funny line. I don't know why.

Some students borrow too little...

Taylor: "Sending a message that all students should try a few years of college, even if it requires taking on tens of thousands of dollars in loans, is borderline irresponsible."

Wow!

Timothy Taylor's conclusion:

Given the growing wage gap between those with a college degree and those without, it will make economic sense for lots of students to borrow, especially at today's rock-bottom interest rates. But with student loans, we're talking about young adults often in their late teens and early 20s making financial decisions that could be with them for decades to come. It's a transaction that should be made with caution and consideration.

My conclusion:

I'm not Ann Landers. This is not a personal advice blog. I don't have much interest in "stories [that] emphasize the problems of particular students". What interests me are the big, sweeping forces that arise from aggregate economic activity, which in turn affect the environment in which economic activity occurs. What interests me is the setting that gives rise to (for example) "the problems of particular students" -- particularly when it seems to be that more and more particular students are having such problems.

"Several decades ago," Taylor writes, "it was a low-risk option to spend a few years working part-time and attending a big public university". But the environment has changed.

I'm not into coping. I'm into solving. I will never recommend that you are cautious and considering when you make your personal decisions. Nor will I recommend you throw caution to the wind.

What I do recommend is that you think about why things have been getting generally worse for "several decades" now. Think about the accumulation of private debt and ask yourself whether it plays some role in that decline.

If you don't have an answer, that's fine. Just keep asking the question.


My first visit to Timothy Taylor's site was to his The Price of Nails.

Fascinating.

Wednesday, April 11, 2012

The Good Son


"Fritz"   1998-2012

Tuesday, April 10, 2012

Incompleteness (2)


After working out my first impressions for yesterday's post, I went back to Mason's at Rortybomb to finish the read and explore the links.

I tried to read Taylor's article, but if you don't subscribe to the Wall Street Journal you only get a fragment. Nothing relevant.

I read the article on Hoenig and was really surprised.
• Hoenig calls for the breakup of large banks.
• In 1996 he "warned about the dangers of expanding the federal safety net to cover financial institutions trading complex derivatives"
• In 1999 he warned "about big, interconnected financial companies."

Hoenig says several things critical of the bigness of finance. That's significant, because apart from the level of interest rates, what matters is the number of times interest costs occur in the economy -- and that has everything to do with the bigness of finance.

He even says

The central bank has to be, in a way, a neutral player, and yet we find ourselves trying to stimulate, and the effect is further leveraging

"Further leveraging" of course means growth of the accumulation of debt; so we agree on the problem, Hoenig and I. But his very next thought shows that he has not yet put one and one together:

If I thought zero rates would bring jobs, I’d want it forever. But it distorts the economy.

He says it is the low rates that distort the economy. Low rates that lead to further leveraging. I don't think that's particularly true. Graph #1 shows the Effective Federal Funds Rate and the Percent Change from Year Ago of Total (TCMDO) Debt:

Graph #1: The Rate of Interest (blue) and the Growth of Total Debt
The blue line -- the interest rate determined by policy -- rises irregularly to a 1981 peak, then falls irregularly to zero.

The red line shows percent change in debt. Total debt. The three largest increases in debt appear near the middle of the graph: before the 1970 recession, and before and after the 1980-82 recessions. The three largest increases in debt occur while the interest rate was at or near its maximum. So it does not seem to be true that low rates are the rates that lead to increased leveraging.

Graph #2 shows the same:

Graph #2: The Rate of Interest (blue) and the Growth of Private Debt

Both graphs show that leverage increases all the time, except now (since the crisis) and also for a while after the mid-1980s (due perhaps to changes in the tax code). The rate of interest seems to have relatively minor effects on the growth of debt.

So it doesn't look like low rates distort the economy.

One who focuses on interest rates but fails to consider also the accumulation of debt is missing the more significant factor.

Monday, April 9, 2012

Results and the Claims of Causality


At Rortybomb, JW Mason examines the idea "that the root cause of the crisis is that interest rates were too low for too long."

Mason quotes John Taylor, who says the Fed "held interest rates too low for too long and thereby encouraged excessive risk-taking and the housing boom."

Mason quotes Thomas Hoenig of the Fed:

We as a nation have consumed more than we produced now for well over a decade. Having very low rates for an extended period of time encourages us to continue focusing on consumption, but to correct our imbalances, we have to focus on production. If I thought zero rates would bring jobs, I’d want it forever. But it distorts the economy. In 2003, when we lowered rates and kept them there because unemployment was 6.5 percent — look at the consequences.

Mason writes:

More broadly, this view is associated with so-called Austrian Business cycle theory, which holds that macroeconomic instability is fundamentally due to departures of the market interest rate from the natural rate... In this view, an artificially low interest rate encourages investment in assets whose returns are lower than the true social rate of discount; when interest rates return to their natural level, investment will be depressed until this excess stock of physical capital is worked off.

That's just the opening part of the post, a concept laid out so it can be evaluated. I didn't get to Mason's evaluation yet. I have to work through the introductories.


It is an easy thing to tell a story and end it with the terrible problems of recent years. That doesn't mean there is any relation between the story and the terrible problems. But it can seem there is this relation, because stories end with conclusions.

John Taylor's story "encouraged excessive risk-taking and the housing boom".

Hoenig's story is "we lowered rates and ... look at the consequences."

Not part of Mason's introductory material, Paul Krugman's story is that we cannot lower interest rates enough because they're already at the lower bound and ... look at the consequences.

I'm not siding with Krugman here. I'm just pointing out that the outcome is always the same. The outcome is always that our problems, the things we don't like in the economy today, are explained by the storyteller's story. The stories always explain the problems. Even when the stories are opposites.


Well, you'd have to expect that, wouldn't you? I do the same thing, I suppose. The goal of the storytellers is to explain the problems.

Still, some stories are better than others. Some stories are thin. "Look at the consequences" is thin. "The results we have are due to the factors I describe" is thin.

Let's take them in order. For John Taylor, low rates led to excessive risk-taking and the housing boom. Low rates for too long.

Sure, there is a parallel of some kind between excessive duration and excessive results. (The parallel is in sentence construction and thematic echoing.) And low rates do encourage borrowing and spending and economic activity in general -- or at least we think they do. But Taylor makes it sound like "risk-taking" is a bad thing, though it is the basis of the entrepreneurial spirit. And Taylor relies on results when he says low interest rates led to the housing boom.

Specifically, Taylor seems not to address the reason the "macroeconomic miracle" of 1995-2000 devolved into the "housing boom" of 1998-2005. Granted, Mason's excerpt leaves out most of what Taylor said. And granted, Taylor would have jacked up interest rates sooner and created the slump in housing sooner. And brought on the crisis sooner, I suppose.

The reason the "miracle" devolved into the bubble is simple and should be obvious: Profit must have been better in the bubble. Money goes where money is, and there was money to be made in the housing bubble, more than in a miracle.

Of course, there is the duration thing that Taylor speaks of, excessive duration. But it's easy to see this, in hindsight. Taylor is pointing out the obvious here, the results. He is not showing that he explains those results. He relies on the existence of the results to make his case for him. This is not good science. It is not even good argument.

Now I will say again the Taylor quote from Mason's introduction is very brief. And I've not yet read the source article. But the brass ring here is not to make claims about causes of things. The brass ring is to demonstrate causes. Some stories are thin.

Taylor's solution would have been to jack up interest rates as the "miracle" was turning into the bubble, and create a recession then if need be. Given that the reason for that turning was the profit motive, the question is not when is the best moment to cripple the economy. The question is why is productive effort consistently less profitable than speculation?

The answer, of course, has to do not only with the level of interest rates, but also the frequency of application of the rate of interest as a cost in our economy. To speak of interest rates but fail to consider the reliance on credit, is to present an incomplete and largely incorrect argument.


The quote from Thomas Hoenig is longer. I will break it up.

We as a nation have consumed more than we produced now for well over a decade.

Well, sure. Production went to China, and consumption followed. The consumption still counts as what we do, but the production doesn't. You have to expect this, when a "mature" and mismanaged economy promotes international trade, and a young and vigorous economy takes advantage of it.

The same owners that used to make money here now make money in China. Microsoft, Google, they're all over there. Why is this encouraged?

Having very low rates for an extended period of time encourages us to continue focusing on consumption, but to correct our imbalances, we have to focus on production.

Why does having low interest rates promote consumption but not production? It's nonsense. Business is drawn to low costs. Does Hoenig suggest business would be better in the U.S. if the high cost of borrowing drove business away?

Or maybe Hoenig means we have to consume less and save more, so that money is available for investment. But if there's money to borrow for consumption, then there's money to borrow for investment. And anyway, if consumption was up, aggregate demand was up, and aggregate supply should have been brought up thereby.

We've been focusing on production since Reagan, by the way. Supply side economics, and all that. It has not worked, of course, and the government has felt pressure to do more for the demand side as well because of it, but this does not mean we have not focused on production. What it means is, the focus on production has failed.

If I thought zero rates would bring jobs, I’d want it forever. But it distorts the economy.

Zero interest rates distorts the economy? This is your concern, Hoenig? Look at the Fed Funds rate:

Graph #1: Federal Funds rate (blue) and 7-year Moving Average (red)

What goes up must come down. The bigger they are, the harder they fall. Look at the trend since 1981, Hoenig, and tell me you couldn't see zero rates coming. We gave supply-side economics thirty years, and it gave us the Great Recession.

In 2003, when we lowered rates and kept them there because unemployment was 6.5 percent — look at the consequences.

There you go again, Hoenig. The results we got are not evidence that your version of the story is right.