I showed this graph on 2 July:
 |
| Graph #1: Gross Domestic Spending as a Percent of Gross Domestic Product |
Got me thinkin'
//
GDP is Gross Domestic Product, the the sum of final spending in our economy in a year. GDS is Gross Domestic Spending, the total of final and non-final spending in our economy in a year. The increases in GDS are measured in dollar volume, not "number of transactions" or any such thing. It's a dollar number. So if GDS increases it is because spending increased, plain and simple. Same with GDP.
One major effect of a change in the GDS/GDP ratio would seem to be a change in spending pressures -- that is, inflation pressures.
//
Whatever cause may lie behind the increase in spending, then, one fact remains: the spending increased. The trend of GDS/GDP, then, in the 1970s, was that costs increased faster than income: GDS increased faster than GDP.
If this is correct, I must be able to see it in business profits -- perhaps profits relative to GDP, certainly in profits relative to expenses.
I'll take that challenge.
 |
| Graph #2:Total Business Deductions Peak in 1982 as a Share of Gross Income |
If deductions rose till 1982 and then fell as a share of revenue, then profit must have done the opposite:
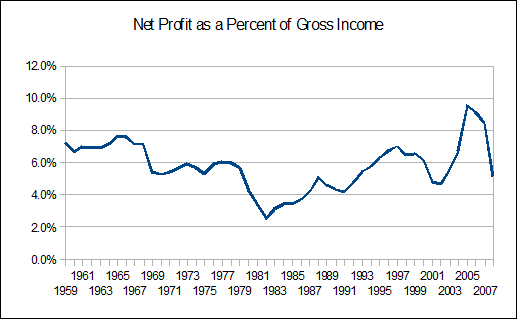 |
| Graph #3: Business Profits hit bottom in 1982, Trending Upward Thereafter That should come as no surprise. |
Profits tended down until 1982, and up thereafter.

1 comment:
Corrected
"Spending increased faster than revenue until 1982, and more slowly that year"
To
"Spending increased faster than revenue until 1982, and more slowly after that year".
Post a Comment