Index mundi provides "United States Crude Oil Consumption by Year" as graph and data from 1980 thru 2013. The numbers are "Thousand Barrels per Day". I'll take their numbers and multiply by 365 to get Thousand Barrels per Year.
FRED provides crude oil prices for WTI crude (since 1986), Brent (since 1987), and APSP (since 1980). The three run close except during 2011-2013. I'll use APSP as it starts in 1980. The APSP crude oil price numbers are Copyright © 2016, International Monetary Fund. The units are Dollars per Barrel.
Using these two sources I can calculate the total cost per year of crude oil consumed in the United States.
 |
| Graph #1 |
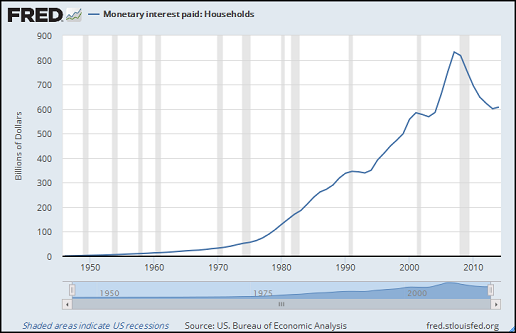
FRED turns up a couple dozen series under the heading "Monetary Interest Paid". If I understand this, it is monetary interest as opposed to imputed interest -- monetary interest being interest actually paid.
One of the series FRED offers is Monetary interest paid: Households. Looks like this:
 |
| Graph #2 |
 |
| Graph #3 |
If you want a better idea of the extent of finance in the U.S. economy I can take Graph #3, swap out household interest, and swap in total interest paid:
 |
| Graph #4 |
Here's my spreadsheet.

No comments:
Post a Comment