I have to recreate this graph:

The blue line is GFDGDPA188S at FRED. It is calculated from Gross Federal Debt (FYGFD) and Gross Domestic Product (GDPA).
The red line takes changes in Gross Federal Debt (FYGFD), strips away inflation using the GDP Deflator (GDPDEF at FRED), and keeps a running total of the adjusted values. And I divided that running total by Real GDP (GDPCA) to get a ratio of reals.
I have to recreate the graph because I ignored debt before 1947, figuring it was small by today's standards. But it was large in comparison to GDP. Comments on my calculation have raised doubts in my mind.
I was thinking about pushing the start-date farther back in time. FRED's FYGFD goes back to 1939, GDPA to 1929. I'm sure I can get numbers for Federal debt before 1939, at least back to 1929.
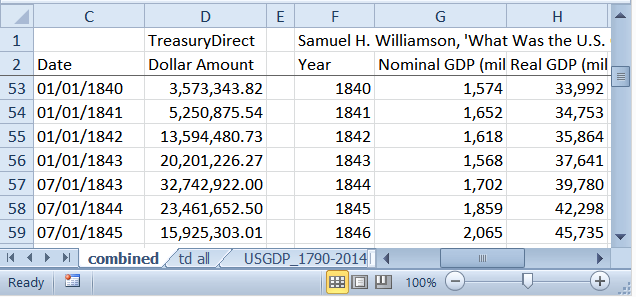
TreasuryDirect has it. Reverse chronological. Of course. But they go all the way back to 1790.
Measuringworth has nominal GDP and real GDP and the GDP Deflator, also all the way back to 1790. And suddenly I realized I have everything needed to show the graph all the way back to 1790. Wow.
Well Auburn, I guess that's why I'm using Federal debt.

I had some trouble getting the TreasuryDirect data into a useful form. There are five separate tables, and when I copied them and pasted into Notepad, two of them ended up with quote marks around the debt numbers. One of the two came into Excel just fine. The other one turned out to be a six hour headache.
Finally, after I gave up on it, I asked the wife if she had a way to convert stubborn data like that. She's a practical girl. She took the TreasuryDirect data, pasted it into Word, searched for quotation marks and replaced them with spaces, then copied it to Excel and Presto, my problem was solved. I think it took her six minutes to do what I couldn't do in six hours.
I went back to TreasuryDirect the next morning and took samples from all five tables, so I could show you. But none of the numbers came out surrounded by quotation marks, and all of them copied over to Excel just fine.
I don't know why.
After I got all the Federal debt data from TreasuryDirect into Excel, and into one file, and into chronological order, I brought in the GDP, Real GDP, and Deflator data from Measuringworth. That part was easy.
But more preparation was needed. I had the 1790 data from both sources on the same row. But the 2014 numbers were on different rows. TreasuryDirect provides one more data item than does Measuringworth, in the 1790-2014 period. That sounds odd, but I was expecting it. The notes for the TreasuryDirect data say
The first fiscal year for the U.S. Government started Jan. 1, 1789. Congress changed the beginning of the fiscal year from Jan. 1 to Jul. 1 in 1842, and finally from Jul. 1 to Oct. 1 in 1977 where it remains today.
I knew about the 1977 change. I've had to correct for extra data there once or twice before. I didn't know about the 1842 change, but given the date it was easy to find:
I suppose the law was passed in 1842 but was not implemented until 1843.
All I had to do was delete one of the two 1843 items. But which? I want to keep the 07-01-1843 entry because the debt is unusually high at that point and it probably means something.
Couple other fixes I had to make before the data was useful. Measuringworth's GDP and RGDP are in millions; the TreasuryDirect data is in dollars. Usually I have to convert Measuringworth data to billions to match FRED's units. But this time I can convert the TD data to millions and leave the rest as is.
I put commas in the numbers, as TD had, to improve readability.
A boring note on the spreadsheet column labels:
I use NGDP for "nominal", and RGDP for "Real", GDP. Anything in the spreadsheet labeled "Debt" refers to Federal debt and traces back to the TreasuryDirect numbers in Column B (unfortunately shown as Column D in the preliminary snip above). And the symbol "Δ" ("delta") means "change in". So "Δ Debt" reads as "change in debt". You might be more comfortable thinking of it as annual deficits.
That much, I hope, is obvious. Now it gets a little messy. If "Δ Debt" in Column G (of the final version) is the deficit, then "R Δ Debt" in Column H is the "Real" (inflation-adjusted) deficit.
In Column J, "Δ Debt" is reduced to "ΔD" to make room for "Accum". In the "ΔD Accum" column I add up the changes in debt. ("Accum" is "Accumulated".) So the accumulated deficit numbers in Column J are equal to the debt numbers in Column B except the number for 1790 is missing. That number is missing because the year before 1790 is missing, so 1790's change from previous year value cannot be calculated.
The same is true for Column K, where "RΔD Accum" stands for "Real Change in Debt, Accumulated"... or the running total of inflation-adjusted deficits.
Column M is the same as Column J, except instead of leaving 1790's "change from previous year" blank, it uses the entire debt 71.06 million dollar Federal debt of 1790. Using that start value, then adding each year's change in debt, all the values in Column M match the original Federal debt values from Column B.
Column M is sort of like checking my work. The next column, N, takes that original 1790 number for the debt and adjusts that whole lump sum for inflation by using the 1790 Deflator number.
That is exactly the same calculation that is commonly used when the "real" (inflation adjusted) value of debt is figured. All of the Federal debt existing (in this case) in 1790 is adjusted using the 1790 deflator number. This is a bad calculation, I say, because much of the debt existing in 1790 (or in any one year) was accumulated in prior years -- and really should be adjusted by the deflator values of those prior years.
I think this is much more of a problem for recent years' debt than for ancient debt. So I'm hesitantly willing to use the flawed calculation for the ancient 1790 number. I couldn't bring myself to use it for the 1947 number in last weekend's calculations, and I very rightly got called out for it.
So, from four columns of source data (B, C, D, E) I have generated six columns of calculated data (G, H, J, K, M, N) -- three columns nominal and three columns inflation-adjusted. The three in each case include one for deficits and two for debt. Which of the two is the better debt measure is still unresolved in my mind.
Based on these six calculated columns I created six additional columns -- in each case the "as a percent of GDP" version. The three nominal columns are shown as percent of nominal GDP, and the three real columns are shown as percent of real GDP.
 |
| From the Open Office Spreadsheet: Long View.ods at Google Drive |

4 comments:
Have you tried Notepad++. http://notepad-plus-plus.org
Notepad++ ?
No, not yet. But thanks for the link. I downloaded it and took a look. Puts Windows Notepad to shame!
Thank you netbacker.
Huge caveat -
There is no verifiable data on GDP earlier than what you can get from FRED.
Measuring worth has estimates. Who knows what they're based on?
cheers!
jzB
yeah jazz i know
you've said the same to me before
but maybe those unverifiable numbers are close enough that we can see in the last graph the relative positions of the red and blue lines that we should expect to find in the first graph.
I will try to say again what I tried to say the other day: the topic of this and the related posts is not the Federal debt. The topic is the effect of inflation on debt, and understanding that effect.
Post a Comment