Wednesday, July 16, 2014

GDS vs GDP: Crude, but you get the idea


The snowplow hit our mailbox last winter. Broke the post. I went out and got a 2x4 and made a new mailbox post. The work was easier than I expected.


The other day I was looking for something in the garage. I found a 3-foot length of 2x4 left over from the mailbox repair. I kept it because... because you never know.


It occurs to me that the 2x4 I bought is a model of Gross Domestic Spending. The part of the 2x4 I used to make the post, well, that's the output, that's GDP, final spending. And the 3-foot difference, that's sort of like non-final spending.


If I had a customer that paid me for the mailbox job, my little metaphor would be more accurate. But as it is, I was the final customer. Mine was the final spending. My work was for my own satisfaction (according to the IRS) so I got no tax deductions for my spending. And my 3-foot leftover piece is just post-consumption detritus. Guess I could pay somebody to haul it to the dump, and that would add a little more to GDP.

What seems to bother most people about GDP is that it doesn't measure happiness. I think that's weird. What bothers me about GDP is that it ignores trillions of dollars of spending just because we get to subtract those trillions from our taxable income. So I invented Gross Domestic Spending (GDS).

Tuesday, July 15, 2014

Analogy

From Friday's notes:

Drove past a construction site on my way to work this morning. Yesterday there were "one lane" signs up. Today all the heavy equipment is off the road, in the clearing they made yesterday. Looks like they will be reconstructing the culvert that lets water flow under the road at that point.

The culvert, the concrete work, the clearing of land, the redirection of water flow -- this is infrastructure I suppose. But think of it as the "institutions" we create to shape and form out economy.

The one thing our institutions cannot change is the fact that water seeks its own level. We cannot change the most important thing about our economy.

Monday, July 14, 2014

"Finally we'd give up on the ideas that worked in the 1960s -- most of them, but not the idea that we always want debt to grow a little faster than the quantity of money, because we always want that."


From yesterday's 4AM post:

What's that you said? They wouldn't do that? You mean, they would never say we always want debt to grow a little faster than the quantity of money? Is that what you think?

Graph #1: Dollars of Debt per Dollar of Base Money

In 1950 there was $12.90 of debt for every dollar of base money. In 1970, $24.3. A peak came in 1990 at $47 debt per dollar of money. This was exponential increase.

The ratio fell from the peak, reaching a low of $39.8 in 1994. Then increase resumed. The ratio reached $60.9 in 2008: More than $60 of debt per dollar of base money.

If the interest rate was 2%, we were paying $1.20 interest for every $1 of base.

After 2008, crisis brought the number down. But it was the crisis that brought the number down. It wasn't policy that did it. This is how you know policy was in error.

We always want debt to grow a little faster than the quantity of money. That's the problem. Other than the last few years, the only place on the graph that we see the ratio fall is from 1990 to 1994.

And after that fall in the ratio, the economy was actually good for a few years.

Sunday, July 13, 2014

"... soon or late, it is ideas, not vested interests, which are dangerous for good or evil"


I am sure that the power of vested interests is vastly exaggerated compared with the gradual encroachment of ideas. Not, indeed, immediately, but after a certain interval; for in the field of economic and political philosophy there are not many who are influenced by new theories after they are twenty-five or thirty years of age, so that the ideas which civil servants and politicians and even agitators apply to current events are not likely to be the newest. But, soon or late, it is ideas, not vested interests, which are dangerous for good or evil.
- J.M. Keynes, TGT, Chapter 24

The power of ideas. You would think so, wouldn't you?

Reading over this morning's post, I thought: The one person who needs to read this is Representative Hensarling of Texas. Figured I'd send a link. I don't expect him to read it, but maybe an underling. Maybe, by chance, my idea would click with somebody who could present it to Hensarling in a way that makes sense to him. What the hell.

It was easy to find Hensarling on the internet. I clicked CONTACT and got the "Step One" page:

"I am unable to reply to any email from constituents outside of the district"
First time I read it, I read as far as Regrettably, I am unable... and said dammit and gave up. But I went back to the Step One page a few minutes later, because I really think he needs to consider my idea. I read a little more this time:

I am unable to reply to any email from constituents outside of the district.

Oh! I can live with that. I don't want a reply from the guy. I want to share an idea with his idea people, that's all. No problem.

Ho, hum. I dutifully filled in my five-digit zip code, then looked around till I found my "+4 extension" and entered that, too. Then I clicked Go To Next Step. Gee, they make it so simple!

Here's what I got next:

"I am only able to accept messages from residents of the 5th District."
Soon or late, it is ideas that matter. I guess. But not today.

"a published formula"


From The New York Times:
House Republicans Resume Efforts to Reduce Fed’s Power
By BINYAMIN APPELBAUM, JULY 10, 2014

WASHINGTON — House Republicans frustrated by the Federal Reserve’s expansive economic stimulus campaign and its growing role as a financial regulator are renewing their efforts to constrain the central bank.

The Fed would be required to set monetary policy based on a published formula under legislation introduced this week by leading Republicans on the Financial Services Committee. Other bills would eliminate the Fed’s responsibility to maximize employment, or eliminate the Fed entirely.

The bills face uncertain prospects in the House, and have no future in the Senate while it remains under Democratic control. But they highlight ideas that Republicans are likely to revisit if they win a majority in both houses of Congress in the midterm elections.

“We have seen a radical departure from the historic norms of monetary policy conduct,” Representative Jeb Hensarling of Texas, who is chairman of the Financial Services Committee, said at a hearing on Thursday. “Monetary policy is at its best in maintaining stable, healthy economic growth when it follows a clear, predictable rule or path.”


It's easy to draw a triangle with all sides equal:


And it is easy to draw a triangle with one square corner:


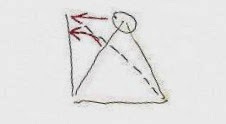
But it is impossible to draw one triangle that has all sides equal and one square corner:


We want to take the top corner of the all-sides-equal triangle (circled) and slide it over to the left (upper red arrow) to make one square corner. When we do that, the one side of the triangle slowly rotates to the left (lower red arrow) and the other side of the triangle stretches out and gets longer (dashed line). But as soon as that side starts to stretch out, the triangle is no longer all-sides-equal, and we have failed at our task!

This sort of thing is obvious to someone like me, who makes AutoCAD drawings eight hours a day. In AutoCAD you can literally grab that corner of the triangle and move it, and you can see what happens when you do.

So if the boss comes to us and says I want an equilateral right triangle, well, it just can't be done.

The boss probably wouldn't come to us with that request. But he does come to us with equally impossible requests. Usually he'll tell us the features he wants in the drawing. And when we draw it, sometimes there is a combination of features that simply cannot be done. I think it's because he's looking at the big picture and not the little details. That's okay. That's my job, the little details.

But if I tell the boss it can't be done -- and if I'm right, of course -- then it can't be done, whether he understands the reason or not. If he gets red in the face and tells me Just slide that top corner over to the left until the bottom corner is square I can do it -- because he's no longer telling me to keep all sides equal. His required combination of features has changed. But he's red in the face, and he doesn't want to hear my story.


To me, the economy is like the triangles. There are some things that just cannot be done. There are other things that can be done. But the boss -- Congress -- is red in the face and doesn't want to hear it. Just make interest rates obey the Taylor Rule he says. Just slide that top point over to the left. Don't worry about keeping all sides equal.


"Monetary policy is at its best in maintaining stable, healthy economic growth," according to Representative Hensarling, "when it follows a clear, predictable rule or path."

Well yeah, that could work. But it won't work if it's the wrong rule or the wrong path. Suppose the rule is we always want debt to grow a little faster than the quantity of money. Think that rule would work? It would work for a while, I guess, like in the 1960s; then it would start to fail, like in the 1970s. Finally we'd give up on the ideas that worked in the 1960s -- most of them, but not the idea that we always want debt to grow a little faster than the quantity of money, because we always want that. And the changes would change things -- we discover thirty years later -- when deleveraging becomes suddenly fashionable.

What's that you said? They wouldn't do that? You mean, they would never say we always want debt to grow a little faster than the quantity of money? Is that what you think? I think you're wrong:

Graph #1: Debt (blue) and Money (green) compared to GDP (red)
They always want debt to grow a little faster than money.

Oh -- see the green line? On the right there. The last half inch of it, or less, where it's no longer flat and so close to zero that it is almost invisible: See it? There around 2009, where it starts to go up. You've seen that before. Everybody showed it to you. By itself, it looks like this:

Graph #2: Base Money (green), the same as on Graph #1
Everybody showed you this graph and expected you to be shocked and dismayed.

It is troubling, I admit. But the increase that looks so troubling on Graph #2 is really next to nothing compared to the growth of debt, as you can see on Graph #1.

It was the growth of debt for half a century and more that was the real problem -- the growth of debt at a more rapid pace than the growth of money, for half a century and more. The shocking and dismaying increase in money we see on Graph #2 was the response to the long period of excessive debt growth: the response to the problem created by the growth of debt.

The increase in money visible on Graph #2 was the response. If you don't believe me, go ask Ben Bernanke.


It is Graph #2 that bothers Representative Hensarling of Texas. He wants the Federal Reserve to follow "a clear, predictable rule or path" and to keep monetary policy on the straight-and-narrow. Hensarling doesn't want the Fed making the quantity-of-money side of the triangle suddenly long. He wants to keep it good and short. He's not happy with the increase in the green line visible on Graph #2.

That's fine. But by itself, his plan won't work. To make it work you have to make sure that the quantity-of-debt side of the triangle also stays good and short. Really, this is just a broadening of the "clear, predictable rule or path" that Hensarling wants.

So there it is, in writing, the Arthurian formula.

Saturday, July 12, 2014

"Unemployment is primarily a problem of macroeconomics"


John Quiggin:

If search models aren’t the right way to think about unemployment, what is the right way? The simple answer is that unemployment is primarily a problem of macroeconomics not of labor markets. If aggregate demand is far below the productive capacity of the economy, workers will be unemployed and capital will be idle.

Reminds me of something JW Mason said:

As soon as you begin to think about employment in terms of an input of labor to a production process, you've taken a wrong turn. We should not try to give supply-based explanations of unemployment, i.e. to show how the allocation of some stock of productive resources by some decision makers could generate unemployment. Unemployment is strictly a phenomenon of aggregate demand...

Unemployment rises when planned money expenditure falls for a given expected money income. Unemployment falls when planned money expenditure rises for a given expected money income. Conditions of production have no (direct) effect one way or the other.

So when we see people unemployed, we should never ask, why does the production of society’s desired outputs no longer require their labor input? That is a nonsense question that will lead nowhere but confusion. Instead we should ask, why has there been a fall in planned expenditure?

I would have missed it, had it not been pointed out twice. But Quiggin and Mason stand apart from the thinking that produces headlines like Drop in U.S. jobless claims points to healing in labor market at Reuters.

Friday, July 11, 2014

A realist, not a fanatic


From When ignorance is power at Stumbling and Mumbling:

It's quite possible that, for some (many) businesses, law-breaking has a positive expected value: the expected benefits of fraud or phone-hacking exceed the expected costs. A profit-maximizing company should therefore undertake them. One way for it to do so is for managers to turn a blind eye so they can maintain plausible deniability, and ensure that if the wrongdoing is exposed that there's no smoking gun to connect them to the crime.

Thursday, July 10, 2014

Bad argument drives good argument out of circulation


At Reddit recently I came across The Great American Economic Growth Myth by Lance Roberts at Streettalk Live. It's a very professional-looking site, "brought to you by STA Wealth Management" the logo says, with links to the Lance Roberts Radio Show. The site even offers "Website Help!"

The growth myth post has lots of good looking graphs, and I couldn't wait to read what Lance Roberts had to say. I was okay with it until I got to this part:
From 1950-1980 nominal GDP grew at an annualized rate of 7.55%. This was accomplished with a total credit market debt to GDP ratio of less 150%. The CRITICAL factor to note is that economic growth was trending higher during this span going from roughly 5% to a peak of nearly 15%. There was a couple of reasons for this. First, lower levels of debt allowed for personal savings to remain robust which fueled productive investment in the economy. Secondly, the economy was focused primarily in production and manufacturing which has a high multiplier effect on the economy. This feat of growth also occurred in the face of steadily rising interest rates which peaked with economic expansion in 1980.


However, beginning in 1980 the shift of the economic makeup from a manufacturing and production based economy to a service and finance economy, where there is a low economic multiplier, is partially responsible for this transformation. The decline in economic output was further exacerbated by increased productivity through technological advances and outsourcing of manufacturing which plagued the economy with steadily decreasing wages. Unlike the steadily growing economic environment prior to 1980; the post 1980 economy has experienced by a steady decline. Therefore, a statement that the economy has had an average growth of X% since 1980 is grossly misleading. The trend of the growth is far more important, and telling, than the average growth rate over time.
Inflation??

Not a word about inflation. Hey, I'm sympathetic to what this guy is saying. "Lower levels of debt" is definitely the key to getting better growth. The focus on production rather than finance is central. And Lance's last three sentences --

Unlike the steadily growing economic environment prior to 1980; the post 1980 economy has experienced by a steady decline. Therefore, a statement that the economy has had an average growth of X% since 1980 is grossly misleading. The trend of the growth is far more important, and telling, than the average growth rate over time.

-- contain an element of wisdom that I tried to capture and use in mine of 5 July:

... when you say "average" it suggests up-and-down variation, but it also implies stability in the value. If intermediate consumption is trending upward as a share of gross output, it is deceptive to speak of its average value.

When I was writing mine, I didn't even realize where the idea came from. That's a nice bit of writing, Lance Roberts. I owe ya one.

But I'm surprised that I got that far reading the article. The paragraph before the graph is simply horrendous. Here, read it again:

From 1950-1980 nominal GDP grew at an annualized rate of 7.55%. This was accomplished with a total credit market debt to GDP ratio of less 150%. The CRITICAL factor to note is that economic growth was trending higher during this span going from roughly 5% to a peak of nearly 15%. There was a couple of reasons for this...

As soon as you read about economic growth reaching almost 15% sometime before 1980, you have to think of inflation. You absolutely have to. But inflation is not noted among the "couple of reasons" Roberts presents in that paragraph. Nor is it noted in the paragraph that follows the graph.

In fact, there is only one occurrence of the word inflation in the whole article:

The economy currently requires $2.75 of debt to create $1 of real (inflation adjusted) economic growth.

There is no reference to inflation's contribution to the growth numbers anywhere in the article. Personally, I think this outrageous. After reading the Streettalk Live article I went back to Reddit to get other readers' reactions. Only one other reader shared my concern. Cassander wrote:

That would be an amazing headline chart, except for the fact that it is a nominal GDP growth graph that peaks at the height of the 70s inflationary period, thus rendering it completely deceptive.

I picked up on that, and replied:

I love graphs and I approached the linked article with great anticipation. But WOW was I disappointed!
The "The Decline of Economic Prosperity" graph displays the effects of the Great Inflation, and considers it great growth. The article doesn't even mention inflation in relation to that graph. The article depends on the reader's ignorance to make its argument.

I went on to express similar disappointment with other graphs in the article. Cassander got back to me:

It's depressing, really. The charts really are extremely well done, they even have nice, nonstandard coloring. Someone clearly went to a lot of effort, but they're all complete nonsense.

I couldn't agree more.


I recreated the Nominal GDP YoY % Growth that Roberts shows in his graph. And so you could see the difference, I added inflation-adjusted GDP, in red.

Graph #4: Rates of Growth of inflating (blue) GDP and inflation-adjusted (red) GDP
On Lance's graph, before 1980, we see a trend of increasingly higher peaks as time goes by. My graph shows that, too, in blue. But if you look at the red peaks, growth with inflation stripped away, the trend is clearly down. Real economic growth was getting slower before 1980, not faster.


We definitely put too much emphasis on finance in this economy. Lance Roberts is right about that. And we definitely have too much private debt in this economy, so much that it hinders growth. And, yes, the inflation that Roberts fails to point out did help to keep debt levels low until around 1980. But the growth that he attributes to all those things that I agree with, the growth he points to explicitly -- "nearly 15%" annual growth -- must be attributed to inflation.

It pains me to say it, because I agree with so much of what he says.

Wednesday, July 9, 2014

"Turn off your television sets" and turn on your speakers