Thursday, March 15, 2012

Private Debt 2012 (11): The Economy Is Transaction


No matter what happens in the economy, it happens with money, or it happens for money, or both. So the cost of money is an absolutely crucial element of economic performance. If the cost of money is too high, it interferes with everything.

No, not just the interest rate. The interest rate is the cost of credit. The cost of money is the cost that arises from applying the interest rate once for every dollar of existing debt. In an economy with lots of debt, the cost of money must necessarily be high, no matter the rate of interest.

In an economy that cannot grow because "interest rates are at the zero bound" and cannot go lower, one can reduce the cost of money only by reducing the reliance on credit. By paying down debt. Or cancelling debt. Or somehow getting rid of debt.

When the crisis hit, the Federal debt (red) was 10% of Total (TCMDO) debt
Oh, and it's private debt that must be reduced.

Wednesday, March 14, 2012

"Repressionomics"


At BBC News Business, Repressionomics - can 'financial repression' solve debt crisis? by Paul Mason:
It was economists Carmen Reinhart and Belen Sbrancia who, in March 2011, issued a ground breaking study of what "financial repression" means.

If we hear today the National Association of Pension Funds complaining that quantitative easing has placed a £90bn hole in the pension system, we can judge how rapidly the concept of "repression" is moving from theory to practice.

So what is "financial repression"? Put simply it is a combination of inflation and capital controls designed to erode the value of debts - and therefore of savings. It is overtly designed to prevent market mechanisms responding to inflation, leaving the price of borrowing too low and the return on savings too low.

Reinhart and Sbrancia pointed to the success of Western economies in "repressing" a mountain of debt after World War II - in a way that avoided fiscal austerity, and allowed a growth spurt, combined with inflation, to cancel out unsustainable debts.

No link, Paul?


The "mountain of debt after World War II" is not the same as today's mountain. After World War II it was a government mountain. The mountain of private debt that had created the Great Depression was gone, "eroded" by repayment, default, inflation, and the rocketing government debt of the second World War.

The mountain after that war was public debt; the mountain today is private debt.

And the "success" of Western economies in "repressing" debt after the war can be attributed largely to the economic growth that was made possible by the relative absence of private debt. But economic growth since the war was accompanied (and financed) by the growth of private debt.

Private debt grew until it hindered economic growth. Then government debt started growing again, and policies were put in place to encourage private credit use. But those policies failed to boost growth, because private debt was already excessive.

Reinhart and Sbrancia don't seem to see it that way:

Hoping that substantial public and private debt overhangs are resolved by growth
may be uplifting but it is not particularly practical from a policy standpoint. The
evidence, at any rate, is not particularly encouraging, as high levels of public debt appear to be associated with lower growth.

"High levels of public debt appear to be associated with lower growth." This is not true for the United States during the "golden" years after World War Two. High levels of public debt were associated with higher growth because private debt was low and did not interfere with private sector growth!


Related posts:
1. Debt Relatives
2. Debt Relatives: Uncle Sam
3. Debt Relatives: The Cousins
4. Debt Relatives: The Rise and Fall of the Non-Federal Relative

Tuesday, March 13, 2012

The analysis is incomplete


JW Mason links to Seven unsustainable processes, again? (short PDF) which contains two quotes that caught my attention. First:

Godley (1999) pointed to seven unsustainable processes which could harm U.S. growth prospects. In our view, a longer, deeper crisis was averted in 2001, without addressing the underlying growth problems, so that the next (current!) crisis was more severe.

Sure, okay. And the rest of that thought, too:

It follows that if the remaining imbalances are not addressed by appropriate policy measures, resuming growth under the same demand patterns will imply further instability.

Yeah. Except for one thing. This pass-the-buck approach to dealing with the longer, deeper crisis does not go back only to 2001. It goes back at least to 1974.


Second:

Some commentators put the blame on monetary policy for keeping interest rates too low, and therefore allowing an ever increasing level of debt.

In our view, low interest rates helped defer the crisis.

Again, sure... Low interest rates DID help defer the crisis. And low interest rates did contribute to the expansion of debt, or at least, did nothing to slow it.

Low interest rates postponed the inevitable and made it worse -- exactly as the PDF posits in the first quote.

It seems to leave us between the rock and the hard place: Jack up interest rates and suffer the consequences now, or leave 'em low and suffer worse, later. But the analysis is incomplete.

I insist: The analysis is incomplete.

Our assumptions so thoroughly permeate our thinking that we fail to see what we're doing wrong. We think we need credit for growth. So we see nothing wrong with increasing our reliance on credit, and increasing it more. And then increasing it more.

And then increasing it more.

But we don't need credit for growth, not so much. Certainly we do not need a volume of credit equal to three and one-half times GDP. One-fifth of GDP is probably twice what we need for growth.

Thing is, we don't just use credit for growth. We use credit for everything. And we don't pay it off. We let it accumulate. We use credit like money and let debt accumulate. We make financial crisis inevitable.

But it's not like we had a choice. It's policy. We use credit for growth because policymakers think credit is good for growth. And they set that in stone.

Oh, and the other thing: They think printing money causes inflation. So the cheap money, interest-free money, there's almost none of it around. But there is plenty of expensive money in use, as evidenced by the size of private debt.

And when the expensive money contributes to inflation, policymakers further restrict the quantity of cheap money, and make the expensive money more expensive. What they ought to do is encourage more rapid repayment of existing debt, to fight inflation.

Monday, March 12, 2012

Mason Rowe


JW Mason:

One of the things you hope students learn in a course like this is that money consists of three things: demand deposits (checking accounts and the like), currency and bank reserves. The first is a liability of private banks, the latter two are liabilities of the central bank. That money is always someone's liability -- a debt -- is often a hard thing for students to get their heads around, so one can end up teaching it a bit catechistically.

Nick Rowe:

...if the central bank money is not redeemable in anything, it's not really a liability...

Point Rowe.

Sunday, March 11, 2012

Prescience


There is no special reason to doubt that exceptional growth will continue...

From The Golden Age of Capitalism, by Stephen A. Marglin, page 39:


Saturday, March 10, 2012

"In Woodford (2011), the word 'debt' occurs just once."


Today's featured publication at the St. Louis Fed -- go to
and hover over Publications on the menu bar -- is The Federal Reserve Bank of St. Louis Review. The first item on the "In This Issue" list is Death of a Theory, a 20-page PDF by James Bullard, President of the St. Louis Fed.

He's sharp, Bullard is. I never read his stuff until I read David Andolfatto's What output gap?. But Bullard has a way of capturing in a single paragraph ideas I sometimes struggle with for months. Not saying I often agree with the guy, but he does come up with some very quotable quotes.

This is not especially one of them:

In Woodford (2011), the word “debt” occurs just once. This is because, within the setting analyzed there and in most of the literature, there is nothing special about government borrowing, as it indicates only that taxes will be collected in the future in such a way that the net present value of taxes and expenditures are equal. Debt might represent a problem only to the extent that it means that the proposed increases in government spending today are not being matched by taxes collected during the same period...

Notice that when Mr. Bullard uses the word "debt" here he is thinking specifically of "government borrowing" and "government spending" and "taxes". When he uses the word "debt" he means only the Federal debt.

When he uses the word "debt", he neglects 80% of debt.

Mr. Bullard, sir, I like ya, but you're never gonna see the problem if you refuse to look at the problem.

Gross Federal Debt (the big one) as a percent of Total Credit Market Debt Owed
Before the crisis, sir, the Federal debt was less than one-fifth of total debt, and had been falling for the better part of two decades.

I count the words as you do, Mr. Bullard. But it's important to count the debt, too.

Fascination


Among the popular series listed at FRED at the moment:

M2 Money Stock 7 hours ago
M1 Money Stock 7 hours ago

So, I clicked M1.

Graph #1: M1, the quantity of spending-money or money in circulation
It goes up. And it goes up especially on the right, in the recent years. And you know, somebody will likely grab this graph and holler about imminent inflation. Again. Or maybe they will show that M1 has been growing at 20% for the last six months now...

Graph #2: Rate of change of M1 money, near 20% for some time now
...and holler about imminent inflation.

Hey, I don't make predictions. I'm not saying we *won't* get inflation. I'm not saying we will. What I am saying is that I think it's silly to grab one fact and start drawing conclusions.

One fact: M1 money has been going up.

So it has. Now, let's go get one more fact. Let's get GDP, and compare M1 money to the size of the economy, like this:

Graph #3: The size of circulating money, relative to the size of the economy, since 2008
Turns out, M1 money has increased from less than ten cents of money per dollar's worth of GDP in 2008, to 12 cents in 2010, to 14 cents now. That's an increase of 40 or 50 percent since 2008. So yeah, the quantity of money has gone up. Shall we panic and holler about inflation?

Not yet. Because we're just looking at the crisis years. The unusual circumstances. Maybe this increase is altogether unusual. I need to know more.

I want to look at M1/GDP for all the years that FRED will show:
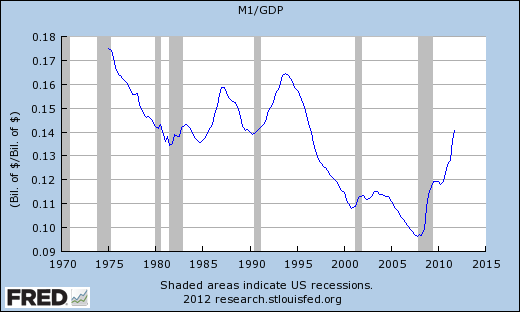
Graph #4: The size of circulating money, relative to the size of the economy, since 1975
There -- there on the right. There is that low spot, where the ratio was down below ten cents of M1 money per dollar's worth of output. And after the low spot, the increase up to 14 cents.

And if you look back to the left along the 14-cent line, you can see that we were at this level before. We were at this level in 1990, and also in the early 1980s just as Paul Volcker was bringing inflation down from those double-digit increases of the 1970s.

And then as inflation came down in the 1980s, the money/output ratio shows a small hump (before 1985) and a big hump (between 1985 and 1990) and another big hump starting around 1990 and peaking around 1994. And then the really big decline that takes us to the year 2000.

That big decline occurs at exactly the same time that the Federal budget came into balance during the Clinton years. Money was taken out of circulation by the Federal government, and used to pay down debt. So there was less M1, so the line goes down.

Before the early 1980s, the graph shows a decline from something over 17 cents of money per dollar's worth of output. But this graph only goes back to 1975.

To see farther back in time, I had to switch to a different data series. The M1NS series takes us back to 1959. And you can see that from 1959 to the early 1980s, there was a more or less continuous decline in the quantity of money relative to output -- 28 cents in 1959, half as much twenty years later:

Graph #5: The size of circulating money, relative to the size of the economy, since 1959
By the way... Pretty much all the while the quantity of money was declining there, the rate of inflation was increasing. In graph #6 below, the red line shows the price level as measured by the CPI. You can see prices curving up, faster and faster from 1965 to the late 1970s when the money/output ratio was falling below 22 cents to 20 and ultimately to 14 cents of spending-money per dollar's worth of product. It is as if there was not enough money to buy the stuff we produced, but prices kept going up anyway, so policymakers kept pushing the quantity of money down more and more...

Graph #6: The size of circulating money relative to the size of the economy, and prices
...except at those odd humps.

And over there on the far right, in the bottom corner, the money ratio finally fell below ten cents, and then we had the sudden crisis that nobody saw coming. And then policymakers decided to push the quantity of money back up to about where it was in 1980, apparently.

And despite all that, for the whole time, prices kept going up.

Friday, March 9, 2012

Chapter and Verse


From the Appendices of Steve Keen's 2011-04-11, This Time Had Better Be Different: House Prices and the Banks Part 2 --

Stagflation


Between 1954 and 1974, unemployment averaged 1.9 percent, and it only once exceeded 3 percent (in 1961, when a government-initiated credit squeeze caused a recession that almost resulted in the defeat of Australia’s then Liberal government, which ruled from 1949 till 1972). Inflation from 1954 till 1973 averaged 3 percent, and then rose dramatically between 1973 and 1974 as unemployment fell.

This fitted the belief of conventional “Keynesian” economists of the time that there was a trade-off between inflation and unemployment: one cost of a lower unemployment rate, they argued, was a higher rate of inflation.

But then the so-called “stagflationary” breakdown occurred: unemployment and inflation both rose in 1974. Neoclassical economists blamed this on “Keynesian” economic policy, which they argued caused people’s expectations of inflation to rise—thus resulting in demands for higher wages—and OPEC’s oil price hike.

The latter argument is easily refuted by checking the data: inflation took off well before OPEC’s price hike.

The former has some credence as an explanation for the take-off in the inflation rate—workers were factoring in both the bargaining power of low unemployment and a lagged response to rising inflation into their wage demands.

The Neoclassical explanation for why this rise in inflation also coincided with rising unemployment was “Keynesian” policy had kept unemployment below its “Natural” rate, and it was merely returning to this level. This was plausible enough to swing the policy pendulum towards Neoclassical thinking back then, but it looks a lot less plausible with the benefit of hindsight.

Though inflation fell fairly rapidly, and unemployment ultimately fell after several cycles of rising unemployment, over the entire “Neoclassical” period both inflation and unemployment were higher than they were under the “Keynesian” period. So rather than inflation going down and unemployment going up, as neoclassical economists expected, both rose—with unemployment rising substantially. On empirical grounds alone, the neoclassical period was a failure, even before the GFC hit.

There was a far better explanation of the 1970s experience lurking in data ignored by neoclassical economics: the level and rate of growth of private debt. As you can see from Figure 32, private debt, which had been constant (relative to GDP) since the end of WWII, began to take off in 1964, and went through a rapid acceleration from 1972 till 1974, before falling rapidly.

The debt-financed demand for construction during that bubble added to the already tight labor market, and helped drive wages higher in both a classic wage-price spiral and a historic increase in labor’s share of national income—which has been unwound forever since.

Thursday, March 8, 2012

Private Debt 2012 (10): Owed on a U.S. Earn


Federal and other debt as shares of total debt:

Federal (blue) and Non-Federal (red) debt as shares of total debt (thru 1985)

So always remember and never forget
The problem lies not with the Federal debt,
But everyone else's debt hinders us all
And leaves us like Humpty was after the fall.
