Thursday, June 19, 2014

Not excessive spending


At David Stockman's Contra Corner, on the History page: America’s Bubble Empire And The Echoes Of Imperial Rome:

The characters on stage are familiar to us — consumers, economists, politicians, investors, and businessmen. They are the same hustlers, clowns, rubes, and dumbbells that we always see before us.

But in today’s performance, they are doing something extraordinary: They are the richest people on the planet, but they have come to rely on the savings of the world’s poorest people just to pay their bills.

No.

Does it make sense that we are the richest people in the world, and yet so much in debt? Maybe, if we all lived in splendor. But we don't.

This is not the problem:

They routinely spend more than they make — and think they can continue doing so indefinitely. They go deeper and deeper in debt, believing they will never have to settle up. They buy houses and then mortgage them out — room by room, until they have almost nothing left.

Even this is not the problem:

They invade foreign countries in the belief that they are spreading freedom and democracy, and depend on lending from Communist China to pay for it.

That all comes down to nothing more than excessive spending. Oh, stick China in there, and war, and the argument starts to take on a life of its own. But prune off the emotional crap, and it all comes down to excessive spending. That is the argument. It is wrong.

Does it make sense that we are the richest people in the world, and yet so much in debt? No. So how did it happen?

We use debt credit for money. That's how it happened.

Wednesday, June 18, 2014

Uptrend to 1966, then stable to 1982, then uptrend again.


Hey.

On 11 June I showed this graph:

Graph #1: Total Factor Productivity (TFP)
I wrote:

Uptrend to 1966, then stable to 1982, then uptrend again. I know I've seen that pattern before. I just can't remember where.

I'll find it eventually.


Browsing my test & development blog a few days later, I came upon these notes:
Saturday, May 3, 2014
It turns a corner in 1966

I have to think about what this graph shows:


...

Dunno, but look at the second graph at SRW's "Not a monetary phenomenon"

http://www.interfluidity.com/v2/4561.html

This one, the second graph today, I'm subtracting number-of-employees from gross-domestic-product. You can't do that. It's vaguely, vaguely related to Okun's law. But you can't subtract people from GDP. It's mixed units. (So, that graph never made it to this blog till now.)

Whatever.

Here's the second graph from Interfluidity #4561:

Graph #3: "RGDP divided by the number of workers in the labor force" -- SRW
(See? You can DIVIDE GDP by number-of-workers. But you can't SUBTRACT people from GDP. Remarkably, though, similar patterns emerge both ways.)


Here's Total Factor Productivity (from Graph #1 above) in blue, left scale, and the Interfluidity graph in red, right scale:

Graph #4, Comparing Graphs #1 and #3
Now that's interesting.

Okun's law defines a relation between employment and output. SRW's graph tests that relation. Looks like variations in that relation are related to Total Factor Productivity.

SRW says the baby boom's entry into the workforce outpaced the advance of technology, and is responsible for the flat spot there from 1966 to 1982. Seems to make sense. The problem I have with the idea is, when I look at that flat spot I can't help but think "that's not my fault. I didn't cause the flat spot." Subjective, yes.

I'm wondering now how they calculate TFP. They probably back into it, plugging results into some calculation and coming up with an immaculate number. The results that SRW's graph shows could easily be responsible for the pattern that TFP shows.

I'm wondering now how they calculate TFP.

Tuesday, June 17, 2014

All cars are suddenly identical? Please, make them all like this:


Source: Jalopnik

What I love about Nick Rowe? His analogies. This is from Bank runs, keynesian multipliers, monetarist cold potatoes at Worthwhile Canadian Iniative:
Car banks. Suppose the Jalopnik devil waved a wand and made cars a fungible asset. All cars are suddenly identical, and will always be identical. Car banks spring up. You give your car to the car bank. In return, the car bank pays you rent/interest, and promises to pay you one car on demand. Since most of the time most people don't need a car, car banks become fractional reserve car banks. There's no profit in having cars sit idle. Owning the bank's promise to pay you one car on demand is as good as owning a car, provided the bank can always deliver on that promise.

I read that, I know we're talking about money and banking. But it helps to think of it in terms of cars. It's like seeing with fresh eyes. But here's something:

Since most of the time most people don't need a car, car banks become fractional reserve car banks. There's no profit in having cars sit idle.

That's the "loanable funds" thing. The car bank gets to loan out the cars to other drivers because it *has* the cars, because we deposited them in the car bank.

Yeah, it works with cars. It works with cars, because a bank cannot create a new car simply by lending it out. It has to actually have a car before it can lend it. That's not true for money. Banks create money by lending it out. (Actually I'm starting to mull that one over. But I'm not ready to talk about it yet.)

Banks create money by lending it out, so they don't need to get our deposits in order to lend. I understand that.

So I have to ask, again: Why do banks want our deposits?

Monday, June 16, 2014

Sometimes something strikes you


I clicked Random Eyes (see sidebar), then clicked random a few times and ended up with M2 velocity:

Graph #1: The Velocity of M2 Money
Click Graph for the FRED Page via Random Eyes
I've seen it before, of course. But this time it looked almost flat to me until that sudden, large uptrend that runs from 1991 to 1995.

Those dates ring a bell for ya? They do for me. That was the time of a strong increase in M1 money growth, and a fall in the debt-per-dollar ratio. With a strong increase in M1 growth, I think M1 velocity probably fell -- just the opposite of M2 velocity. That's odd, if true, and it's worth a look:

Graph #2: Velocity of M1 (red) and M2 (blue) Money
Shown on Right and Left Scales Because the Numbers are Quite Different
I left the data box visible, and maybe you can see just at the end of the 1991 recession, a one-pixel-wide, slightly darker gray vertical line. Where that line crosses the red and blue plot lines FRED has added pink and blue circles to highlight the first quarter of 1991 on those plot lines.

Sure enough, beginning in the first quarter of 1991, M1 velocity (red) trends down while M2 velocity (blue) trends sharply up. M1 continues down to fourth quarter 1993; M2 continues up till first quarter 1995.

Velocity of money is calculated by dividing GDP by the quantity-of-money number. GDP is GDP, the same for the red line and the blue. So the difference between the two lines is due to differences in the M1 and M2 money numbers. Compare growth rates:

Graph #3: Growth Rates of M1 (red) and M2 (blue) Money
As expected, M1 money (red) shows a big growth spike beginning just after that 1991 recession, while M2 money growth (blue) slowed to near zero. There is a similar red spike in the mid-1980s but the blue line is much higher then. So the "gain" in M1 (red) was not as big in the mid-1980s as in the early 1990s.

There was a change in M1 accounting in 1994 that reduced the amount of money reported as M1 money:

Sweep programs create distortions between reported data on the monetary aggregates and accurate measures of the money stock.

In order to correct for these distortions, Graph #4 duplicates Graph #3 using M1 that has "sweeps" added back in:

Graph #4: Growth Rates of M1 + Sweeps (red) and M2 (blue) Money
For the period from the mid-1990s to the most recent data, the two lines are noticeably closer on Graph #4 than #3. But the big difference between the two lines in the early 1990s remains.

To see the difference in growth rates, I took the two lines from Graph #4 and subtracted the one from the other. I'm trying to see how much faster (or slower) the one money measure was growing, than the other. I subtracted M2 from M1. That means that when the difference is above zero M1 is growing faster, and when the difference is below zero M2 is growing faster:

Graph #5: Growth Rate of M1 + Sweeps less Growth Rate of M2

The big gains for M1 show up as large mid-1980s and early-1990s peaks on Graph #5. There are two much smaller peaks in the 2000s, and some unevaluable activity since 2008. Other than that, the blue line is almost always below the zero-line: M2 almost always was growing faster than M1.

What makes this more interesting is that M1 money is a component of M2 money. If you take M2 and split it into the money we expect to spend and the money we hope to save, M1 is the part we expect to spend. The rest is money we're trying to save. So basically, Graph #5 shows that our savings have almost always grown faster than our spending-money, except during those two massive spikes and a few brief interludes.



If you take Potential GDP, which is a measure of best-case GDP, and put its growth rate on Graph #5, it looks like this:

Graph #6: Growth Rate of Potential GDP (red) Overlaid on Graph #5
The general trend of Potential GDP -- the red line -- is downhill. The one notable exception to this downtrend is the uptrend created (says I) by the massive spike in M1 money growth in the early 1990s.

Why? Because no matter what you want to do in this economy of ours, it takes spending money to do it.

Sunday, June 15, 2014

Try typing "asshole" and see what you get


In the sidebar at La Bocca della Verità, an invite to RealClearPolitics:

Type Bigotry Into Google, See What you Get

How could I resist? But I did, though. I didn't type anything into Google. I just clicked the invitation. Despite their run-on sentence.

They show this image:


"Why is 'right-wing' a correlation to bigotry?" the accompanying text asks. "Why is bigotry a descriptor to 'right-wing?'"

That's why I'm here. Why is "right wing" a correlation to bigotry? What the hell does that even mean? I guess they mean Why is "right-wing" correlated to "bigotry"?

It isn't, of course. Not in the example sentence, anyway.

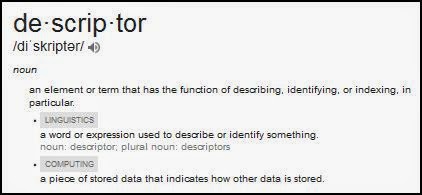
The other one means even less: Why is bigotry a descriptor to 'right-wing?' A "descriptor"?? I looked that one up on Google:


A descriptor is a word used to describe or identify something. So: Why is "bigotry" used to describe or identify "right-wing"?

Again: It isn't. If the word "bigot" was used to identify or describe a right-winger, you could say "bigot" and people would know you're talking about a right-winger. But the actual phrase used is "right-wing bigotry". And that surely implies that there is also left-wing bigotry. Otherwise, you wouldn't have to say which side you're talking about.


But actually trying to understand what the words mean, that's not really part of the game anymore. The game now is to cultivate outrage.

Decline of civilization.

Saturday, June 14, 2014

Happy-go-lucky economics


In a PDF dated February 2000, Dea... // No, wait. Let me start again

In a PDF from the year 2000, Dean Maki of the Federal Reserve wrote:

Household debt is at a record high relative to disposable income. Some analysts are concerned that this unprecedented level of debt might pose a risk to the financial health of American households and ultimately lead them to curtail their spending...

A high level of indebtedness among households could also lead to increased household delinquencies and bankruptcies, which could threaten the health of lenders...

And then there's this:

In stark contrast to the view of growth of consumer credit as a negative force in the economy, a consensus seems to be emerging from recent research that consumer credit growth is positively related to consumption in future periods. Little evidence has been found that household debt service burdens are negatively related to future consumption, though some theoretical models suggest a more complex relationship may be at work. Specifically, high debt service burdens could make household consumption more sensitive to a drop in income...

It strikes me that the economic research seems to focus on current events without regard for macroeconomic principles. As long as everything's going along fine, the consensus emerges that everything is fine. Nobody looks at the subtle changes that could be a sign of troubles -- nobody looks at them as potential troubles, anyway -- because everything is going along fine.

It's happy-go-lucky economics.


From Maki's conclusion:

Consumer credit growth is often viewed in the press and on Wall Street as a negative force in the economy that will cause future consumption to slow. The available research on this question suggests quite the opposite: Strong growth in consumer credit tends to be associated with positive future growth in consumption...

From this point of view, high debt burdens are not a negative force in and of themselves; they should only be viewed as a problem to the extent that the expectations of future income on which the borrowing was based were too high.

Maki equates "growth in consumer credit" with "high debt burdens". Oh, these two are related, to be sure. But they are not the same. To equate "credit use" with "debt" is to equate "buy now" with "pay later". If you cannot distinguish between the two, you cannot understand the economic problem of our time.

Friday, June 13, 2014

Let's have some fun


At FiveThirtyEight: The Slow Death of American Entrepreneurship by Ben Casselman. From the article:
Americans started 27 percent fewer businesses in 2011 than they did five years earlier, according to data from the Census Bureau. As a share of all companies, startups have been declining for more than 30 years.


Declining since the late 1970s. Interesting.

Among possible causes of the decline, Casselman points out that "The U.S. economy is also increasingly dominated by large corporations". By coincidence, perhaps, Casselman also mentions "the long and well-documented decline in family-owned businesses."

Trends like that don't sit well with me.


I tried to figure out what data was used for Casselman's graph, with no success. But I found some more graphs at BLS. Graphs are always fun.
The number of new business establishments (establishments that are less than 1 year old in any given year) tends to rise and fall with the business cycle of the overall economy. As shown in chart 1, the number of new establishments for the year ending in March 2010 was lower than any other year since the series began.


This graph starts out with a pretty good increase. But it starts in 1994. The pretty good increase is what we got during the good economy of the latter 1990s. If you look at the graph without thinking of that, you might imagine the same strong uptrend stretching back in time another ten or fifteen years. I doubt it.

Another feature of this graph: The drop associated with the Great Recession started in 2006. That's noteworthy.

Next, Chart 5:
As shown in chart 5, the period from 1993 to 2006 was marked by an increase in the number of births and deaths, indicating a higher amount of business “churn”—that is, new business establishments entered and old establishments exited the economy in greater numbers. Since the most recent recession began in December 2007, births have experienced the steepest decline in the history of the series. New establishments are not being formed at the same levels seen before the economic downturn began, and the number is much lower than it was during the 2001 recession.


Sure enough: new establishments are not being formed, and the number is much lower. But doesn't it strike you as odd that this is all we get in the way of commentary from the BLS? I'm not the policymaker. I'm the critic. I'm supposed to be the guy saying "Hey, the economy isn't doing well." BLS is supposed to do a little more than that, don't you think?

I also don't like it that they say things like "the steepest decline in the history of the series". The history of the series? "The period from 1993 to 2006" is only about a dozen years. The series isn't old enough to have something you could call a history. When you're old as I am, you'll understand.

Like the second graph (BLS Chart 1), the third one (BLS Chart 5) shows an early-onset decline of establishment births, 2005 or 2006. But the peak in employment gains from startups came even earlier. BLS Chart 6 (not shown) indicates that

The number of jobs created from establishment births peaked in the late 1990s and has experienced an overall decline since then.

Trends like that don't sit well with me.

Thursday, June 12, 2014

Notes on a Sunday morning

From the 8th of June.

The wife watches the Sunday morning news commentary. George Stephanopoulos is on at the moment. We have republicans attacking the President for retrieving a soldier from the Taliban. This is presented on TV as a struggle between republicans and democrats. That's wrong. The actual struggle is much bigger and far more interesting.

The economy -- you remember, we do economics here -- the U.S. economy has been deteriorating for a long time. This deterioration is a challenge in the Toynbee sense: During the life of a "civilization" there is a series of "challenges" which are met with "responses" by a "creative minority". As long as the response provides a satisfactory solution to the challenge, the civilization advances. When the response is inadequate, civilization goes into decline. It's a remarkably simple analysis.

The U.S. economy has been in decline for a long time -- since the 1974 recession, at least. This decline is our challenge. To the rest of the world, it seems the U.S. is weak and vulnerable. That is the motivation behind attacks like the ones that took down the Twin Towers and damaged the Pentagon.

As Toynbee put it, a civilization that is not advancing is in decline. We need a response suited to the economic decline that is the challenge of our time. We've been responding for forty years now, without success; internal discord only grows more strident.

It's time to try a different response.

Wednesday, June 11, 2014

Oh! I've seen this shape before...


Been looking into the Solow Growth Model just a bit, lately, and took a look at Total Factor Productivity:

Graph #1: Total Factor Productivity (TFP)
Uptrend to 1966, then stable to 1982, then uptrend again. I know I've seen that pattern before. I just can't remember where.

I'll find it eventually.