Suppose I have a mortgage payment that's equal to my weekly paycheck. But then after a few years of 1970's style inflation, my paycheck has doubled. Well, the mortgage payment is still the same. So now it only costs me half a week's pay.
Existing debt comes to look smaller as a result of inflation.

If I may paraphrase Jazzbumpa:
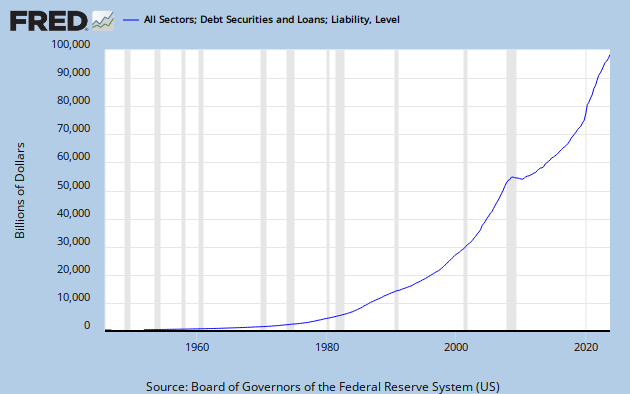
Art wants to tell a story where debt growth has been on a continuously increasing trajectory through the entire post WW II period. Clearly this was the case, until the onset of the recent recession.
Jazz disagrees, showing this graph:
 |
| Graph #1: Household Credit Market Debt Outstanding relative to Wages & Salary Accruals |
Of this graph, Jazz writes:
The graph above shows there was an actual decrease in debt burden in the 60's, then only a slight increase during stagflation and the moribund Carter administration.
I responded to that, as follows:
True enough. BUT... (and I didn't figure out how to look at this yet)... there was Big Inflation in those years where debt does not rise a lot. I'm thinking, wages went up a lot and maybe additions to total debt went up a lot, but existing debt shrank probably a lot relative to the inflation of the time... and this is probably why the graph flattens out in those years.
This is what I want to look at: What does inflation do to accumulating debt?
I worked it out in an OpenOffice spreadsheet:
Suppose I start with debt equal to 50% of my income. And suppose I borrow an amount equal to 3% of my income each year, allowing this debt to accumulate. But beginning in year 5 and lasting to year 10, there is inflation and my income increases at 5% per year. Note that my new borrowing increases with my income, but my existing accumulation of debt is reduced by inflation.

Inflation reduces the burden of pre-existing debt. So even with new borrowing that increases in proportion to rising income, accumulated debt stabilizes as a portion of income.
If new borrowing increases at a slower rate than inflating income, accumulating debt will decline as a portion of income. This is the reason Jazzbumpa's graph shows "an actual decrease in debt burden in the 60's, then only a slight increase during stagflation".
The OpenOffice spreadsheet (download)
The Google Docs spreadsheet (view)

6 comments:
This is the reason Jazzbumpa's graph shows "an actual decrease in debt burden in the 60's, then only a slight increase during stagflation".
1) It's not my graph, it's yours. I was responding.
2) It's not THE reason, it's A reason (I say it again.) Else there should be a consistently inverse relationship between debt burden and inflation.
Clearly, there is not, as a glance at the 90's vis-a-vis the naughts reveals. (This is the subject graph divided by CPI.)
Huge difference in the posted graph; not much difference in the linked graph.
Here's CPI - 90's and naughts up the the GR are essentially equal.
Sure inflation helps eliminate debt. That was conventional - and correct - wisdom for a long time.
But it is not the only thing going on.
Cheers!
JzB
You're good, Jazz. I know you're good because the first time I read your remarks I get torqued. I have to read them 2 or 3 times (over 2 or 3 days) before they make sense to me. And then they're just really interesting.
My graph is CMDEBT relative to WASCUR (household debt relative to wages & salaries). Your linked graph is the same, but divided by the CPI. Since CPI goes up, your version of my graph goes down. I get that. I'm not sure what the significance of your calculation might be.
I come back to this occasionally: I don't like to "correct" debt for inflation this way. I don't like to divide debt by a price index. I think debt is doubly-deflated that way, in error.
I'm not delighted with dividing by CPI,either. But a denominator provides context that is meaningful in this discussion.
If new borrowing increases at a slower rate than inflating income, accumulating debt will decline as a portion of income.
This is a tautology, not an explanation.
But borrowing and inflation are both variable over time. In the 90's there was little change in Debt/Income while the inflation adjusted value actually declined a bit.
In the naughts, debt/income shot up dramatically, while the inflation adjusted value barely budged. Meanwhile, there was very little difference in CPI between the two periods.
{BTW, I'm having a really hard time wrapping my head around that.}
And you need to rethink think this:
I don't like to divide debt by a price index. I think debt is doubly-deflated that way, in error.
Not so.
Cheers!
JzB
Maybe I'm misunderstanding the graph, but I agree that nominal debt divided by nominal wages should NOT be then divided by CPI.
The nominal debt already "equals" (("real" debt) * CPI)
And the nominal wages similarly "equal" (("real" wages) * CPI)
So the "CPIs cancel" and the graph is the ratio of debt to wages.
I don't think that dividing by CPI again gives you anything meaningful.
Nice, Jerry.
For me: If I borrowed $100 in 1972, that transaction originated in 1972 dollars. Today it takes maybe $520 to equal the purchasing power of $100 in 1972. But the amount of principal on that old loan is still just $100.
Typically, to "adjust for inflation" you divide the subject number by the price index. This "deflates" inflated prices.
But if I divide my old $100 debt that way to "correct" for inflation, the result is something like $20. I don't know what that is, but it's not a meaningful measurement.
I think what I mean (in that context) is, the wages are already inflation-correcting.
Say you were making $10k/year in 1972 and got the $100 debt, and let it sit until now. Say you are making the same "real wage" - now $52k/year. $100 used to be 1% of your salary but now it's like 0.2%.
So, $100 / $52k is already "deflated". it's 1/5th of what it would have been in 1972. In some sense.
If you divide it again and call it $20 then you're looking at $20/$52k, which is not right (0.04% or something instead of 0.2%). Because you're comparing the debt in 1972 dollars to the wage in 2011 dollars. Or whatever.
(i'm not disagreeing with you, just rephrasing my statement using your more clear example.)
Post a Comment