Start with Real Gross Domestic Product from FRED:
 |
| Graph #1: "Real" GDP |
Look at the "percent change from year ago" picture:
 |
| Graph #2: Change rate, "Real" GDP |
Download the numbers from that. Upload to Google Docs. Crop off the years before 1948, where Depression and global war exaggerated the numbers. Generate a 5-year moving average for what's left.
 |
| Graph #3: "Real" GDP change rate and 5-yr Moving Average |
Looks to me that RGDP is trending down. But how can I make it more clear?
Eliminate the RGDP and just keep the moving average.
Okay. What else?
If RGDP was a straight line, trending down, I could make an "X" of it by putting a second copy of it on the graph, backwards. That graph would compare the oldest years to the newest years, and not-so-old years to not-so-new years, and like that. And it would be easy to see what was higher and what was lower.
That would work, even if RGDP wasn't a straight line.
It does work:
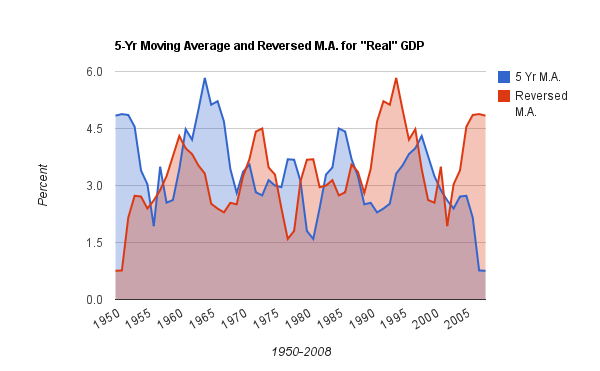 |
| Graph #4: The Moving Average (blue) and Reversed Moving Average (red) |
The actual moving average is blue. The reversed moving average is red. Where blue is high in the early years, the graph supports the view that growth has been declining. Where blue is high in the later years, it contradicts that view.
At the left side of the graph we see large blue peaks and small red peaks. That means growth was much better in the 1950s and '60s than in the recent years.
At the right side of the graph we see small blue peaks and large red ones. That means growth in the more recent years was not as good as in the early years.

2 comments:
I've been looking at GDP growth since I started blogging. Here is the first post I can find.
http://jazzbumpa.blogspot.com/2009/02/disturbing-look-at-gdp-growth.html
This one is interesting.
http://jazzbumpa.blogspot.com/2010/02/if-you-invent-better-indicator.html
Here's a trend line and and tax rates, for context.
http://jazzbumpa.blogspot.com/2010/02/more-about-taxes-and-gdp.html
Here it's dissected in an odd way.
http://jazzbumpa.blogspot.com/2010/02/republicans-all-wrong-all-time-pt-71.html
The data indicates pretty clearly that things have declined since the golden age, and strongly suggest Rethug policies are the cause.
Cheers!
JzB
Oh, that 21-year moving average (in your first link) shows the decline really well...
Post a Comment