Wednesday, August 10, 2016

I predict vigor because that's what the graphs show me.


After a decline in the Debt-per-Dollar (DPD) ratio, the economy is vigorous.


I was looking at this graph back in the 1980s:

The Debt-per-Dollar Ratio, 1916-1970
The DPD ratio goes up until we get the Great Depression. Then it goes down until we are ready for a Golden Age. Then it goes up again.

There are not a lot of big changes on this graph. There are two: One downturn, and one upturn. To me the fewness of big changes is evidence that the ratio is an important one. And the timing of the changes -- the relation to the Great Depression and to the Golden Age -- is profound evidence of its importance.

Moving on...

The Debt-per-Dollar Ratio since 1970
The same DPD ratio, this time for newer data. At right, the downtrend since 2008, and bottoming now. This graph does not show the impending uptrend; but the line always wants to go up. With the upturn will come vigor.

In the early 1990s there is a smaller downturn, which was followed by the "Goldilocks economy" of the 1990s. Vigor in the 1990s.


If you need more, you can find the same pattern in "debt service" data:

Household Debt Service
And in the "private to public" (P2P) debt ratio, which you saw on Monday.

Tuesday, August 9, 2016

Where's Lambert?


I came across this in comments, from October 2014:

I think Edward Lambert has it right. The business cycle is close to it's end point and profits will decline because there is nowhere for demand to come from. See his recent posts at AB.

I always have trouble with Lambert's stuff. It is like I missed page one of the story, and can't make sense of what he says by starting on page two. As I recall, though, Jazz is right: Lambert was saying the business cycle is close to its end point.

That was a couple years back. Is Lambert still expecting recession? Yes, about a 70% chance.

Household Debt Service Payments
I ask because my view is quite the opposite of recession. I expect vigorous growth. Household debt service payments have fallen from 13% to 10% of Disposable Personal Income. Consumers now have 3% of DPI to play with.

Financial costs are down. That is where the increased demand will come from.


Just off the top of my head: If consumer spending is two thirds of GDP ... and if consumers have 3% more of DPI to spend ... and if human nature leads people to spend the money, then just off the top of my head GDP growth should be 2% higher. Because two thirds of 3% is 2%.

That's 2% on top of the two or two and a half percent growth economists envision.

I don't know what's going to happen. I don't like to make predictions because I'm always wrong. But the money has to go somewhere.

I think that if people have 3% of their disposable income lying around, accumulating, consumer confidence is going to improve. Between that and the spending, the economy will pick up. Then people will notice things are getting better. It will become a meme. Then it will become a trend.

By then, of course, we'll be spending that 3% of disposable income, and more. Household borrowing will accelerate, and yadda yadda yadda. Before you know it, we'll be in trouble again. Which is why I keep saying we need policy to stop encouraging the accumulation of debt, and we need policy to start encouraging the repayment of debt.

And we need that policy change in place now.

Monday, August 8, 2016

Good Starts, Bad Endings and Private-to-Public Debt


Sunday, August 7, 2016

About the vigor created by our next President


"The underlying reality of low growth", Neil Irwin says, "will haunt whoever wins the White House in November". I don't think so. I expect vigor, no matter who wins the White House in November.

I think it would be pretty ironic if Hillary Clinton gets elected. Because what I'm looking at amounts to vigor starting about a year into the first term of the next U.S. President. If Hillary is elected, we will be hearing stories that it takes a Clinton to create economic vigor. But Bill Clinton had no more to do with the good economy of the 1990s than Hillary does with the good economy of 2018-2024.

It would be more accurate to say that the changes which created the good years of the latter 1990s happened mostly during the Reagan and H.W. Bush years; and that the changes which will create the good years to come happened mostly during the Obama years.

For the record, the vigor of the 1990s was made possible by a big drop in debt growth (1985-1991) combined with a big increase in spending money (1990-1994). The debt-per-dollar ratio shows this as a decline (1990-1994). That decline was followed by unusually rapid increase (1995-2000). This increase was the source of the funds that made vigorous growth possible in the latter 1990s.

The changes are indicated in red on the graphs below:

Graph #1: The Growth of Total Debt
Graph #2: The Growth of Spending Money
Graph #3: The Debt-per-Dollar Ratio

You can see the same effects in the graph of household debt service.

Graph #4: Household Debt Service

The stage has already been set for the vigor that will be attributed to our next President.

Saturday, August 6, 2016

All the vigor that fits on my screen


China, China, Nevada ("continuing to recover").
Large cities, China, Me.
A phrase from a definition.
China, California (vigor and frailty), and an essay that sounds interesting.

Nobody talks about vigor in the U.S. economy, not any more. Nobody predicts vigor. Just me, and maybe Courtney Farquhar. I'll have to look.

Like space technology (sorry Elon) economic vigor now belongs to China. To a patriot like me, that hurts.

But anyway, still, in August of 2016, nobody is predicting a vigor for the U.S. economy. Just me and maybe Courtney. Remember that when the vigor is upon us.


I checked the Courtney thing. I had to re-install Adobe Flash Player so that Prezi would run.

The file looks like a short demo, or maybe Courtney was figuring out how to use Prezi to make a presentation. I like this quote on economic vigor in the 12th (?) century:


But that's about all there is to the Courtney thing. Oh, and FWIW, "Courtney Farquhar" appears to be a pseudonym. Who knew?

After I did that screen capture and came back to Blogger my cursor was gone. Looks like a Prezi problem. I don't like that too much. Reset.

So anyway, we got vigor in China, and vigor in 12th century Europe, and recovery in Nevada and frailty in California, and not really anybody predicting vigor in the U.S. economy in the years ahead the near future. Just me.

Friday, August 5, 2016

Time will tell


"Looking at any debt or credit crisis as part of an ordinary economic cycle," Barry Ritholtz says, "is destined to be wrong." He writes

The defining characteristic of any recovery from a credit crisis is ongoing debt deleveraging, meaning that households, companies and governments are primarily using any economic gains in income or borrowing costs to reduce their debt. Low rates are not being used to buy homes, but rather to refinance existing obligations. Hence, the entire current post-crisis period has seen only mediocre retail sales gains and slow GDP growth...

Eventually, we will slog our way back to “normal”...

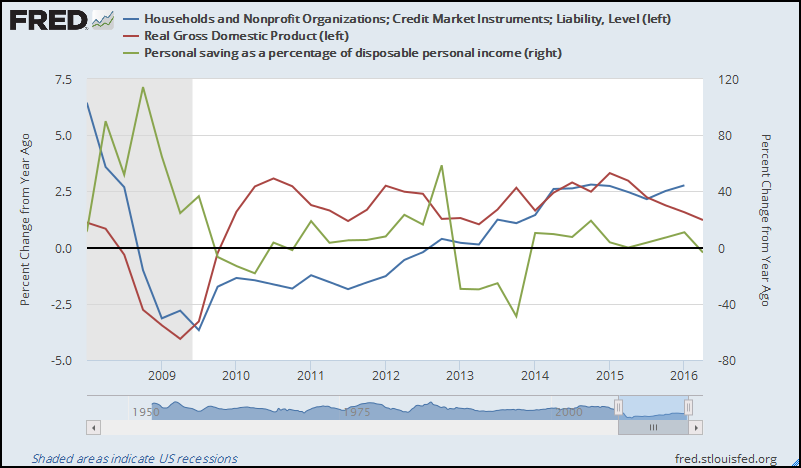
Ritholtz has it exactly right. GDP growth was slow because people were deleveraging. The big drop and the below-zero part of this graph show the deleveraging:

Graph #1: Year-on-year Growth of Household Debt
Since 2013, when the blue line went above zero, households have been re-leveraging again. But not at a rapid rate. We have been "slogging". Still, human nature being what it is -- and judging by the way my wife can go thru money -- I expect the growth of household debt to continue upward.

If the increase during the next five years duplicates the increase of the past five years, the household debt graph will look something like this:

Graph #2: If the Increase Continues...
By 2020 household debt growth will be approaching the 7.5% rate, just where it was in the best years of the 1990s.

Deleveraging reduces the cost of debt service as a percent of disposable income. It frees up money for other uses. But you can't buy as much with that freed-up money as you could if you used it to service an addition to your debt. (You can buy a lot more with newly borrowed money than you could with one year's debt service on the newly created debt.) During deleveraging, as Ritholtz says, we get "only mediocre retail sales gains and slow GDP growth".

The deleveraging of household debt ended when the blue line came up above zero, at the end of 2012. But retail sales remained mediocre and GDP growth remained slow because household debt growth remained close to zero -- close to no debt growth at all. Debt growth increased gradually, reaching 2.5 percent in 2014 as Graph #1 shows.

Incidentally, household debt growth has remained near the 2.5% level since mid-2014. I think this explains the listlessness of GDP growth since 2015.

Work thru this next graph with me:

Graph #3: Growth Rates of Household Debt, Personal Saving, and Real GDP
During 2009 and into 2010, a large drop in personal saving growth (the green line, falling) and a decrease in deleveraging (the blue line moving up, toward zero) contributed to a large increase in real GDP growth (the red line, going up).

In 2011 continued deleveraging (blue below zero) slowed GDP (red) growth while the growth rate of personal saving hung close to zero.

In 2012 deleveraging (blue) reached zero while personal saving (green) increased. Now it was saving that was holding the GDP growth rate down.

In 2013 saving (green) went negative. And debt growth came up above zero, then continued up to the 2.5 percent level. These changes contributed to the increase in real GDP (red) growth in 2013 and 2014.

The blue and red lines cross in third quarter 2015. After that, saving (green) runs near zero (no change) and debt (blue) sustains the momentum it has achieved. However, real GDP (red) growth drifts lower for three consecutive quarters. If my analysis is wrong, this is where the error shows up.

In other words, yeah, maybe GDP growth will continue dropping off, and maybe before long we'll end up in recession. But then, as I like to say, I don't make predictions. I just try to figure out how the economy works.

I think my analysis is correct. I think that with household debt growth remaining at 2.5% and personal saving remaining near zero, we should see increase in personal consumption expenditure and we should see increase in real GDP growth.

Time will tell.

Thursday, August 4, 2016

This turned out to be a good day


Via Reddit, The big puzzle in economics today: why is the economy growing so slowly? by Timothy B. Lee at Vox. (The article quotes Josh Mason on productivity, by the way.)

Theory #4 on the Vox list of possible reasons for slow growth is my own personal favorite, The economy is weighed down with debt. Mr. Lee writes

This seems like a plausible explanation for the early years of the post-2008 recovery. But at this point, it’s been almost eight years since the financial crisis. That should be more than enough time for households and businesses to get their debts down to manageable levels. So the longer growth remains sluggish, the less plausible this theory becomes.

My response:
That's what I've been saying. Not "more than enough" time, no, but just about exactly enough time.

Household debt service fell quickly since 2007Q4, then slowed and bottomed out. Now it is starting to go up again. Increasing debt service implies growing debt, which means growing spending, which means improved GDP growth.

Likewise, total credit to the private sector fell quickly relative to circulating money, then slowed, then bottomed out. It is now ready to start going up again, and this too means improved GDP growth.

So if the economy surprises us over the next couple years by starting to grow surprisingly fast, don't be surprised.

Also... if economic growth improves in the coming years it will be evidence that Theory #4 was correct. At that point, we are going to have to create some tax incentives to accelerate the repayment of debt, which will fight inflation, reduce debt, and with luck prevent the next financial crisis.

Acceleration


The debt-per-dollar graph since 2009... percent change from previous period...


It has finally worked it's way above zero. And look at the vigor!

Wednesday, August 3, 2016

GDP is not a good predictor of recession


Just for the hell of it, I downloaded quarterly data from FRED for the same period we looked at yesterday -- the start of 2009 to the most recent data. I put a Hodrick-Prescott on it in Excel, using a constant of 1600. That's the constant I'd ordinarily use for quarterly data. Here is the result:

Graph #1: Quarterly RGDP since Q1 2009 with an Unresponsive H-P Constant

As with yesterday's post, I did the graph over using a more responsive constant:

Graph #2: Quarterly RGDP since Q1 2009 using a More Responsive H-P Constant
This is similar to the second graph yesterday. The highs and lows follow the same basic pattern. And the third peak is still high and long, relative to the others. But the blue line has been "all downhill" since the start of 2015. And the red line mimics that downhill trend.

The second graph here and the second graph yesterday are similar except for the RGDP data for the last year or so. The difference seems to be in the data itself, not in the H-P calculation.

So I grabbed the GDPnow data from FRED, for comparison:

Graph #3: GDPnow thru Q2 2016
Well, this data goes up at the end. Not down. I guess we'll have to wait and see which one's right.