"Looking at any debt or credit crisis as part of an ordinary economic cycle," Barry Ritholtz says, "is destined to be wrong." He writes
The defining characteristic of any recovery from a credit crisis is ongoing debt deleveraging, meaning that households, companies and governments are primarily using any economic gains in income or borrowing costs to reduce their debt. Low rates are not being used to buy homes, but rather to refinance existing obligations. Hence, the entire current post-crisis period has seen only mediocre retail sales gains and slow GDP growth...
Eventually, we will slog our way back to “normal”...
Ritholtz has it exactly right. GDP growth was slow because people were deleveraging. The big drop and the below-zero part of this graph show the deleveraging:
 |
| Graph #1: Year-on-year Growth of Household Debt |
If the increase during the next five years duplicates the increase of the past five years, the household debt graph will look something like this:
 |
| Graph #2: If the Increase Continues... |
Deleveraging reduces the cost of debt service as a percent of disposable income. It frees up money for other uses. But you can't buy as much with that freed-up money as you could if you used it to service an addition to your debt. (You can buy a lot more with newly borrowed money than you could with one year's debt service on the newly created debt.) During deleveraging, as Ritholtz says, we get "only mediocre retail sales gains and slow GDP growth".
The deleveraging of household debt ended when the blue line came up above zero, at the end of 2012. But retail sales remained mediocre and GDP growth remained slow because household debt growth remained close to zero -- close to no debt growth at all. Debt growth increased gradually, reaching 2.5 percent in 2014 as Graph #1 shows.
Incidentally, household debt growth has remained near the 2.5% level since mid-2014. I think this explains the listlessness of GDP growth since 2015.
Work thru this next graph with me:
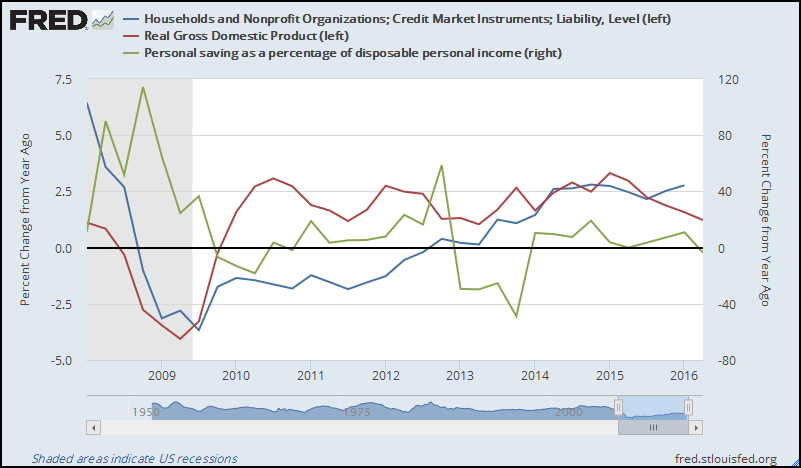 |
| Graph #3: Growth Rates of Household Debt, Personal Saving, and Real GDP |
In 2011 continued deleveraging (blue below zero) slowed GDP (red) growth while the growth rate of personal saving hung close to zero.
In 2012 deleveraging (blue) reached zero while personal saving (green) increased. Now it was saving that was holding the GDP growth rate down.
In 2013 saving (green) went negative. And debt growth came up above zero, then continued up to the 2.5 percent level. These changes contributed to the increase in real GDP (red) growth in 2013 and 2014.
The blue and red lines cross in third quarter 2015. After that, saving (green) runs near zero (no change) and debt (blue) sustains the momentum it has achieved. However, real GDP (red) growth drifts lower for three consecutive quarters. If my analysis is wrong, this is where the error shows up.
In other words, yeah, maybe GDP growth will continue dropping off, and maybe before long we'll end up in recession. But then, as I like to say, I don't make predictions. I just try to figure out how the economy works.
I think my analysis is correct. I think that with household debt growth remaining at 2.5% and personal saving remaining near zero, we should see increase in personal consumption expenditure and we should see increase in real GDP growth.
Time will tell.

1 comment:
I don't expect household debt growth to remain at the 2.5% level. I expect it to increase, because that's how we roll. Mood probably has a lot to do with it: The economy will very gradually improve until people start noticing the improvement and start to increase their spending as a result. Then the improvement becomes more obvious.
I think even with household debt growth remaining at 2.5% and personal saving remaining near zero, we will see increase in personal consumption expenditure and real GDP growth. But I don't think household debt growth will remain at 2.5%. I think it increase (and more than personal saving increases) with the result that personal spending and GDP growth will accelerate.
I expect vigor. In two years, I won't be the only one saying it.
Post a Comment